Blog

Food Demand Survey (FooDS) - December 2015

The December 2015 edition of the Food Demand Survey (FooDS) is now out.

Some observations from the regular tracking questions:

  • Compared to last month willingness-to-pay for all products, particularly beef products, was up.
  • There was a sizable drop in the proportion of respondents who say they plan to eat out more in the next two weeks.
  • There was again a big spike in awareness and concern for E. Coli and Salmonella, likely as a result of the publicity surrounding the Chipotle outbreaks,
  • There was a large increase in visibility of GMOs in the news in the past two weeks.
  • The fraction of respondents who said they suffered from food poisoning doubled compared to last month.

Three new ad-hoc questions were added this month.

The first set of questions dealt with consumers perceptions of different animal welfare labels. Respondents were asked: “Which of the following labels, if seen on a meat or animal product in a grocery store, do you think would indicate and assure the highest and lowest levels of farm animal welfare?”

Participants were then shown images of nine different labels (randomly ordered across surveys) and were asked to click three labels and move them to a box indicating the highest level of animal welfare and then click three of the labels and move them to a box indicating the lowest level of animal welfare.

Here's what we found.


More than half the respondents put the following three labels in the highest welfare category: Certified Humane, Animal Welfare Approved, and American Humane Certified. Two labels, 100% natural and non-GMO verified had nothing to do with animal welfare and they were generally ranked neither high nor low. The largest percentage of respondents placed the Tyson brand label in the lowest animal welfare category, but it had more “highest welfare” category placements than Global Animal Partnership or Food Alliance Certified. The Global Animal Partnership label (which showed a Step 4 rating) was most likely to not be placed in either
the the highest or lowest welfare categories.

The next set of questions were added to investigate issues related to consumer aversion/acceptance of GMOs and perceptions of corporate involvement and control.  The questions came about as a result of a Q&A after a talk I game in Amsterdam last month at the Conference on Coexistence between Genetically Modified (GM) and non-GM based Agricultural Supply Chains.  In particular, Norbert Wilson from Auburn followed up and helped devise the following questions.  

We first asked, “How much would you support or oppose a genetically engineered food or crop (aka “GMOs”) created by the following organizations?” Then, fourteen different entities were listed (in random order across respondents), some of which were specific company names and others that were generic entities.  Respondents replied on a 1 to 5 scale ranging from strongly oppose to strongly support.


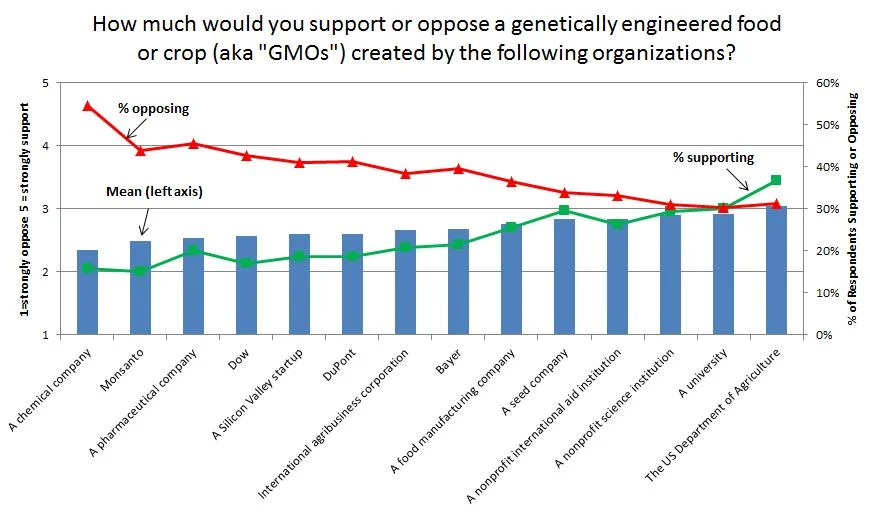
GMOs from a chemical company, Monsanto, and a pharmaceutical company were the were least supported. GMOs from a non-profit scientific organization, a university, and the USDA were most supported. For the latter two categories the percentage of respondents supporting equaled or exceeded those opposing. 

Finally, the last question asked, “Of all the possible benefits that arise from the genetically engineered (or “GMO”) food and crops currently being produced, what percent of the benefits do you believe go to the following entities?” Eight different groups were listed (in random order), and respondents had to allocate 100 points across the groups.


Respondents thought seed, chemical and farm input suppliers received the largest share of the benefits (at 17.7%) followed by governments and food processors (each at about 15%). Farmers were next at almost 14%. At the bottom were consumers (10.6%) and universities (8.7%). 

Who consumers think benefits from GMOs appears to have some relationship with concerns and acceptance of GMOs.  Recall, one of our standard questions asked every month is how concerned that GMOs pose a food safety risk in the next two weeks.  When we calculate correlations between GMO concern and the distribution of benefits from above, there are some statistically significant correlations.  The larger the perceived benefits to consumers and farmers, the lower the perceived concern about eating GMOs.    

Similarly, the correlations between the average level of support for GMOS made from the 14 entities indicated above and perceptions of who benefits are shown in the following table.  People who think universities and consumers benefit more from GMOs are more likely to support GMOs.  By contrast, people who think seed, chemical, and farm input suppliers and governments benefit more are less likely to support GMOs.

Genetically Modified Pigs 2

Yesterday I linked to a recording of a panel discussion on GMO pigs.  I now see that CBC news has an article on the topic.  Here's a bit of what I had to say:

Jayson Lusk, an agricultural economist at Oklahoma State University, agrees.

”These are all very different traits that have very different potential impacts,” he told The Current.

However, most people don’t know much about genetic engineering, he said.

”So I think that makes it hard to discuss with someone in the general public.”

He noted that the genetic modifications that researchers are making to pigs are “aimed at addressing what we’d all probably agree are important problems.”

”There are risks with these technologies, there are risks with every technology,” he said. “There are also risks with not approving these technologies.”

But he acknowledged that surveys show that the public has a general aversion to genetic modification and is willing to pay more to avoid GMO products.

”I don’t think it’s necessarily a fear of genetic engineering — it’s a fear of uncertainty,” he said.

That aversion can be offset somewhat if people know why the animals are being modified, he added.

Genetically Modified Pigs

A few weeks ago I participated in a panel discussion on CBC radio out of Canada on the topic of genetically modified animals.  They aired the story this morning.  You can list to the whole thing here.

The Cost of Animal Welfare Regulations

I was interviewed by Joshua Miller for a story in Boston Globe about an upcoming voter initiative in Massachusetts that would ban the sale of animal products that come from production systems that do not allow the animals to turn around or fully extend their limbs.  As is usual in these stories, there is a lot of back and forth and speculation about the potential cost implications.  

I'm happy to report that we don't have to speculate nearly as much.  We now have some solid research on the topic related to the impacts of the animal welfare laws that went into place in California at the first of this year.  

The first is a paper with Conner Mullally, where we use grocery store scanner data in California and non-California locations to study the change in egg prices caused by the new animal welfare laws in that state.  We find the new laws increased egg prices in California by about $0.75/dozen. The abstract:

New animal welfare policies on the horizon in many states have prompted debates
about the cost of achieving happier hens and hogs. A recent policy change in California
offers a unique opportunity to measure the economic repercussions of minimum space
requirements for egg-laying hens. Using retail scanner data from large California and nonCalifornia markets, we use difference-in-difference estimators to identify the effect of
minimum space requirements on retail egg prices, quantity sold, and sales value, while also
estimating impacts of the policy change on consumer welfare and egg producer net
revenue. We estimate that the law increased egg prices by about 22%, decreased quantity
sold by around 8%, and increased the value of sales by about 12%; the price and sales
effects are statistically significant at conventional levels. In the three California markets
included in our data set, consumer welfare losses amount to approximately $30 million
over the 16 weeks immediately following implementation of minimum space requirements
while net revenue from eggs sold in the three California markets increased by between 11%
and 15% over the same time horizon. Positive impacts on producers may have been short
lived, however, and were likely concentrated among producers located in California. Our
results are robust to several tests of our identifying assumptions. Overall, our findings
indicate that the potential economic costs of mandated improvements in farm animal
welfare should be taken seriously when considering such policy changes.

And a key graph:

The second paper, with Trey Malone, looks at price changes in California relative to the US overall using price reports from the USDA Agricultural Marketing Service (this data set doesn't have quantity or sales data).  The abstract:

California voters passed Proposition 2 in 2008, which outlawed the use of battery cages. Subsequent legislation also outlawed the sale of eggs from battery cages in the state. While a number of ex ante studies have attempted to project the effects of the housing prohibitions, the ultimate ex post effects are unknown, in part because the law was only recently implemented. Using a new price series reported by the USDA Agricultural Marketing Service, we study the movement of daily egg prices in California and the rest of the United States from January 2014 until July 2015. Using two different methods, we calculate difference-indifference estimates to identify the effect of Proposition 2’s implementation on egg prices.
Depending on the method and model specification used, we find that Californians now pay $0.48 to $1.08 more for a dozen eggs. The estimates suggest that the laws result in a reduction in consumer surplus of between $400 million and $850 million annually.

A key figure from the paper.  Unlike the data directly from the retail level used in the first paper, these USDA-AMS data show CA and non-CA prices rising before the January 1 implementation date, though the gap between the two widens afterward.

It's comforting when you have two different papers using two different data sets and different methods that yield similar results.  And it appears that the removal of the so-called battery cages in California have led to a price increase of $0.50 to $1.00 per dozen eggs.  Given that our first study shows little movement in quantities, the data suggest the price change is a result of increased cost (or reduced supply) not because consumer demand for eggs increased as a result of the change in hen living conditions.  

Food Demand Survey (FooDS) - October 2015

The October 2015 edition of the Food Demand Survey (FooDS) is now out.

There were sizable declines in willingness-to-pay (WTP) for all food products; meat and non-meat alike.  At this point, it's unclear what is driving the decline because other measures on the survey, such as food expenditures both at home and away from home remained steady and slightly increased.  In the coming months, I hope to find time to do some serious analysis on effects of seasonality and day-of-week effects given that we now have about two and a half years of data.

Another notable result from the survey is a decline in price expectations for beef, pork, and poultry.  In some cases, the percentage of people anticipating higher prices is less than half of what it was a year ago at this time.  

Consumers reported hearing more about antibiotics and less about Salmonella in the news this month.  

Several new ad hoc questions were added to the survey this month. One set of questions related to food waste. These will be reported separately at a later date.

Another set of questions dealt with consumers’ opinion on policies related to farm animal confinement, similar to Proposition 2 that passed in California in 2008. Of particular interest was whether the framing of the issue affected voting outcomes.

Respondents were randomly allocated to one of three conditions. One third of participants in the first condition were asked to vote on an initiative that: “requires that all animals in your state live in production systems where the farm animals are confined only in ways that allow
these animals to lie down, stand up, fully extend their limbs and turn around freely.”

Respondents in the second condition were asked a similar worded question except it was framed as a ban on the sale rather than production. The initiative: “requires that all animal-derived food sold in your state comes from production systems where farm animals are confined only in ways that allow”.

Respondents in the third condition were asked the same question as in the second condition but “requires” was replaced with “prohibits”. The initiative: “prohibits the sale of all animal-derived food in your state from production systems where farm animals are confined in ways that do not allow”.

Participants were asked to respond “Yes, in favor”, “No, in opposition”, or “Unsure”.

Overall, the majority of respondents stated they would vote “Yes, in favor” in each of the three conditions. Despite the very different implications of the first and second initiatives, voting outcomes were nearly identical in the two conditions. In fact, framing had very little effect, aside from a “prohibition” eliciting more yes votes than a “requirement”.