Blog

What do meat eaters and vegetarians spend on food?

Bailey Norwood and I have a new paper forthcoming in the journal Ecological Economics that seeks to identify how much money vegetarians spend on food relative to meat eaters.  This issue is of interest because food costs are often a reason touted for reduced meat consumption.  The argument is that meat is expensive and thus eschewing meat (or participating in meatless Monday, for example) will save you money.  Here additional motivation for the work:

The implications of the dietary costs of vegetarians goes beyond the impacts on one’s wallet—it will help determine the carbon footprint of meat, dairy, and eggs. If a vegetarian spends less on food, what do they do with their remaining income? And do those other purchases have higher or lower carbon impacts? If vegetarian diets have both a lower carbon footprint and a lower price-tag, then one cannot really determine the carbon impact of becoming a vegetarian without accounting for how those food savings are spent. If vegetarians spend 15% less on food but use those savings on a plane flight, then their overall carbon footprint might rise. Indeed, Grabs (2015), who labels this a “rebound effect”, found that half of the carbon footprint reduction attributable to a vegetarian diet actually disappeared after accounting for the carbon effects of the remaining expenditures. Like Berners-Lee, Grabs infers the expenditure patterns of vegetarians using an amalgamated dataset using inferred (rather than observed) prices paid by each individual, where US data on the differences between the diets of vegetarians and omnivores based on Haddad and Tanzman (2003) is assumed to hold true for Swedish citizens.

Even if the cost of food isn’t a prime reason typically given to adopt vegetarianism, environmental impacts are, and what Grabs shows is that the two items are related. A better understanding on the relationship between vegetarian diets and food expenditures is thus warranted not just because it helps us understand the monetary consequences of altering our diets, but the environmental consequences as well.

We used data from my monthly Food Demand Survey (FooDS) to determine how much vegetarians report spending on food at home and away from home compared to meat eaters. The analysis is complicated by several factors.  First, many of the people in our survey who say they are vegetarian or vegan actually choose a meat item in a prior portion of the survey that simulates a shopping experience (perhaps because someone else in their household eats meat).  Thus, we conduct our analysis separately for "true" vegetarians (about 2.2% of the sample) and "partial" vegetarians (about 3% of our sample).  Secondly, vegetarians/vegans differ from meat eaters in a variety of ways, such as gender, political ideology, income, etc.  This raises the question of whether differences in gender, income, etc. explain differences in spending patterns or whether it is dietary choices.  Moreover, while one can change from from a meat eater to vegetarian, one cannot (easily) change from male to female, very conservative to very liberal, or black to white.  Thus, we conduct several counter-factual simulations where we ask what happens if one converts to vegetarianism but retains their prior demographic characteristics vs. someone who differs in both regards.  

Here are some summary statistics on distribution of spending by meat eating status (not controlling for demographic or income differences)

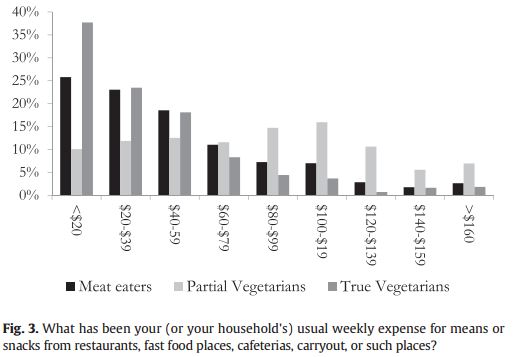
It appears "partial vegetarians" spend more on food than the other two groups, however, when one looks at the demographics this group is also a bit richer, is more likely to have children in the household, and has larger household size - all things that are correlated with higher food expenditures.  

After adjusting for differences in demographics, we continue to find differences in spending patterns, though the differences are typically smaller.  Here are some graphs I constructed using the estimates in the paper. The figure shows spending for each consumption group assuming each group has demographics equal to the mean demographics in the sample (i.e., each group has the same demographics) for different levels of income.  

In general, richer households spend more on food than poor households regardless of whether one eats meat or not.  However, at every income level, partial vegetarians spend more than meat eaters while true vegetarians spend less (assuming same gender, household size, etc.).  For example, for households earning between $60,000 and $79,000 per year, weekly spending on food for meat eaters is $156, for partial vegetarians its $196, and for true vegetarians its $116.

Here is the same result expressed as a share of income (these are the so-called Engel curves).

Meat eaters in households earning between $60,000 and $79,000 per year spend about 11.6% of their income on food for partial vegetarians at the same income level it's 14.5%, and for true vegetarians it 8.5%.

Of course, these three groups don't have the same incomes.  The percent of respondents living in households making more than $100,000/year is 11.3% for meat eaters, 18.3% for partial vegetarians, and 14.4% for true vegetarians.  Thus, if one adjusts for differences in household income, some of the differences shown in the above graphs disappear.

Here is a summary of what we found.

To the extent that self-reported food expenditures are reliably correlated with actual expenditures, true vegetarians spend less money on food than meat eaters and partial vegetarians spend more. Although this result might be used to suggest that meat eaters could replace their meat with vegetables and save around $20 per week in food, this is deceiving. Roughly half of these savings are not due to the change in types of food purchased, but demographic differences. There are certain demographics that one can change in an effort to better mimic true vegetarians. Two of these are body mass index and political attitudes, but although they can be modified by the individual, their impact on food expenditures is small if not zero. The demographic traits that help true vegetarians save money must then reside with more fixed factors like household size, gender, and the like.

Changes in Meat Consumption

There's been a lot of discussion lately about changes in meat consumption over the last year or two.  Much of it seems to have been generated by a Rabobank report (based on USDA's data and projections).  For example here's a representative tweet.

There were headlines like: "America Cannot Kick Its Meat Habit".  Yesterday there was a story at Vox.com (in which I am quoted) that summarizes now dated cheers by animal advocates that meat consumption was falling.  This new news seems to contradict those claims.  

So what's going on with meat consumption?  I think it's useful to take a step back and take a longer view.  Here's USDA quarterly data on per-capita meat consumption (it's technically a measure of "disappearance" not consumption) going back to 1980.  Note: these are the same underlying data driving all the headlines.

Over this long time period, there has been a general decline in beef consumption, falling or steady pork consumption, and the big story is rising chicken consumption.  "Yes" it appears over the past few quarters or so there has been increasing total meat consumption, but that's mainly a result of eating more chicken.  Moreover the total consumption levels in 2016 are lower than they were in 2002-2006.

What caused the total meat consumption decline from roughly 2006 to early 2015?  Most journalists seem to want to focus on demand-side factors.  The typical story was that consumers were more concerned about health, environment, animal welfare, etc.  These might have played some role, but the much bigger driver is likely supply-side issues.  I noted these issues back in 2014 (see here and here for longer discussions).  In short, consumption was down because prices were high.  Prices were high because of supply-side issues like drought, high feed prices, a disease issue in pork, etc.  

Why is consumption starting to tick back up?  The answer is same as it was before: prices.  Here are changes in relative meat prices over the same time period as the previous graph.

Here's what I wrote back in July 2014 near the price peaks

Ultimately, the old adage is likely to hold: the cure for high prices is high prices. The high meat prices we’re seeing today will eventually encourage larger beef and pork supplies, which eventually will put downward pressure on prices. When will that day come?

Looks like the answer is "now."  

The long term price trends shown above also help explain the rise in chicken consumption over time.  While all meats are today more expensive than in 1980s (some of this is due to inflation - the prices changes above haven't been adjusted for inflation), today chicken is "only" about 200% more expensive than it was in January 1980 whereas beef and pork are both about 264% more expensive than in January 1980.  

Here's a graph of the price changes just since 2010 (January 2010 = 100).  These graph show relative changes, but if you look at actual price levels, it's also apparent why chicken consumption is up.  In July 2016, the USDA reported prices for beef, pork, and chicken were $6.09/lb, $3.78/lb, and $1.44/lb.  

The main message here is that we don't need to grapple for complex, convoluted stories to explain  recent changes in meat consumption.  The prices of meat have fallen (because feed is less expensive and because there are larger inventories), and lower prices encourage consumers to buy more.  It's just basic economics at work.  

AAEA Newsletter

My first President's Column for the the Agricultural and Applied Economics Association (AAEA) newsletter is now up.   Here's what I had to say (for ease of readability, I chose not to put the whole thing in quotes):

It is an honor and a privilege to serve as the AAEA president over the next year.  My job is made easier because of the capable leadership and vision of prior presidents and boards.  The Association is in a strong financial position and we have stable membership numbers.  For all those who were able to make it to Boston, it is evident that we have a vibrant, well-attended annual meeting that shows off the diversity of interests and talents of our members.  I even heard one person remark, “The AAEA is back!” 

However, we have more work to do.  For the association to remain relevant, we need to find ways to engage and provide value to early career professionals who are the future of the association.  Cheryl DeVuyst and Norbert Wilson (the past and current chairs of the AAEA mentorship committee) are working with me to organize a symposium in the late spring or early summer of 2017 for early career professionals.  The aim is to provide practical advice on successfully navigating the rigors of an academic career, and to provide an opportunity for young professionals to meet their peers and form a strong cohort for the future.  Be on the lookout for additional details about the symposium in the coming months.

We are continuing to keep an eye on the Association’s publications, and at the end of September, the AAEA executive board and the editors of the AEPP and AJAE will meet to strategize and plan for the future.  Some of topics of discussion will include impact factors, the rising number of submissions, invited papers, and opportunities for special issues or alternative types of submissions. 

As incoming president, I was frequently asked about the cost of our annual meetings.  Early registration for regular members and students were $405 and $105 for the Boston meetings.  Our meeting registration rate is much higher than the ASSA meetings (which were $55 last January in San Francisco), but with roughly 10 times our attendance, the ASSA has much more bargaining power, not to mention the benefit of holding their meetings in the off-season.  AAEA’s registration rates compare more favorably to similar associations.  Regular member registration rates for the most recent WAEA & CAES, NAREA, AERE, and SAEA meetings were $268, $260, $325, and $400; for students the respective figures were $195, $155, $250, $200.  Thus, AAEA’s registration rate is somewhat higher for regular members but quite a bit lower for students as compared to our sister associations.

It is important to note that the board has strategically chosen to operate the meetings at a loss—to the tune of about -$70,000 in both 2014 and 2015.  Said differently, membership dues, income from journal subscriptions, and other revenues subsidize the annual meetings.  Thus, registration would be more expensive if the meetings were priced at cost.  The implicit subsidy arises because of a belief that getting a bulk of our members together in one place at the meetings creates a variety of positive externalities.  It is, of course, possible to choose lower cost meeting locations.  At present, we solicit bids from a number of locations and contract several years in advance in an effort to hold down cost.  However, meeting attendance often falls when the meetings aren’t located in major cities.  Moreover, we need locations that can provide enough meeting space to meet our needs.  We use a large amount of meeting space relative to the number of hotel rooms booked, an outcome resulting from an effort to maximize involvement in the meetings.  All this is to say that there are a number of difficult tradeoffs in choosing a location related to attempts to promote attendance, meeting involvement, paper and presentation quality, keep down cost, and more.  The good news is that attendance this year in Boston was fantastic, only outpaced in recent history by the number of attendees in Washington, D.C., in 2013.   

I welcome comments and suggestions on these and other matters of relevance to the Association.  I look forward to working with you over the next year.

Politics of Food Reform

James McWilliams has an interesting article in the Pacific Standard on how the food movement's ideals have fallen by the wayside in recent political discussions. As he notes, eight years ago when Obama was first running for office, the food movement was soaring.  McWilliams argues that the food movement got derailed by fights about overly-simplistic dichotomies and food labels, which ultimately hindered their efforts and left consumers confused and activists demotivated.  

He writes: 

The ultimate answer to this question hinges on the misguided categories through which agricultural reformers have long used to affect change. The various dichotomies we have conventionally used to frame the general debates over food — organic/conventional, genetically modified organisms (GMO)/non-GMO, family farm/industrial farm, local/non-local, grassfed/feedlot, and so on — has had three outcomes that, in the last decade, have started to render food reform unpalatable to most political actors.

The problem with these dichotomies are that they, firstly:

have left consumers vaguely confused. This confusion has subjected them to considerable labeling manipulation. Consider the organic industry’s recent attack on the voluntary non-GMO label.

Secondly:

the conflicts generated by these terms are exacerbated by the fact that the labels rarely conform to the associations imposed upon them. This divergence further leaves consumers in a fog of confusion and, in so doing, alienating political interest for an altogether different reason.

The final problematic outcome of past efforts, according to McWilliams, is:

our clumsily conceptualized food categories involves agribusiness. To the extent that progressives have articulated a vision of agricultural reform, they have done so in a way that allows agribusiness giants to worship at the altar of progressive standards.

While I do not fully buy into McWilliams vision for a future of farm and food policy (and I think he misdiagnoses the economic reasons why we grow so much "corn and soy — to feed a handful of animal species — mostly chickens and cows", his critique of the efforts of the food movement are insightful and spot on.  Of course, there is another reason the grander visions of the food movement that involve "a new set of organizing principles" has failed to materialized.  That vision isn't palatable to most farmers and consumers and would require a fair amount of coercion to achieve.  

Regardless of the broader issues at play, McWilliams' article is highly recommended.

Food Demand Survey (FooDS) - August 2016

The August 2016 edition of the Food Demand Survey (FooDS) is now out.

A few if the items from the regular tracking portion of the survey:

  • After a spike up last month, willingness-to-pay (WTP) for steak fell 12%.  WTP for other meat products remained relatively steady compared to last month.
  • Awareness in the news of all items we track (but one) increased in August compared to July, and the largest percent increases in concern were cloning and hormones.
  • Consumers anticipate lower prices for beef and indicate they plan to eat more beef and chicken this month compared to last.
  • Consumer are spending slightly more at home and less away from home on food this month compared to last.

Three new ad hoc questions were added this month.

I was recently made aware of some programs being pursued by food and agricultural organizations to add labels to food advertising, for lack of a better phrase, social causes.  So, I was curious what consumers thought of these sorts of programs.

First, participants were asked: “Imagine seeing a label on a food product that pledges a portion of the proceeds from the sale of the food go to a particular social cause or group.  Which of the following social causes or groups would be most appealing to you?  Participants were asked to rank each of the outcomes on a scale of 5 to 1 where 5=most appealing and 1=least appealing. 

On average, participants ranked a label pledging a “portion of the proceeds go to a local food bank to help the hungry” as the most appealing.  Participants ranked a label pledging a “portion of the proceeds go to a campaign to promote healthy eating and exercise” as the least appealing.   The following figure shows the percent of respondents who ranked each issues as most appealing: More than half the participants ranked "Portion of the proceeds go to a local food bank to help the hungry" as most appealing.  

Second, participants were asked “Which of the following characteristics would be most important to you when shopping for eggs? Please allocate 100 points to the following characteristics in terms of the importance in deciding whether and which egg option to buy (total points must sum to 100).”

Six different characteristics were shown in random order. 

On average, “Price: low vs. high price” was most important when shopping for eggs, with 26 out of 100 points allocated to this issue on average across participants. The brand of eggs was rated as least important with less than half the points allocated to brand than price.  Size was, on average rated slightly more important than cage vs. cage free, whereas color was slightly less important than this issue.  

These statistics can provide a crude estimate of willingness-to-pap (WTP).  Presuming respondents perceive that the gap between low vs. high prices is a $1/dozen difference, then for every dollar change, mean rating falls by 26 points.  By contrast, going from small to large eggs increases the mean rating by about 20 points.  It follows that people would give up 20/26=$0.77/dozen to have large instead of small eggs.  Using similar logic, WTP for cage free vs. cage is $0.67/dozen, brown vs. white is $0.48/dozen, proceeds to preferred social cause vs. none is $0.46/dozen, and least to most preferred brand is $0.46/dozen. 

Presuming respondents perceive that the gap between low vs. high prices is a $2/dozen difference, then for every dollar change, mean rating falls by 26/2 = 13 points. And, in this scenario, WTP for large vs. small eggs is 20/13 = $1.55/dozen.  WTP for the other attributes also double under these assumptions.

Lastly, I added the question, "Are you a member of the AmeriCorps program?"  This question was added in response to a suggestion I received at the end of my AAEA presidential address.  As I discussed a few days ago, one of the points of discussion in my talk related to predicting vegetarian status.  I mentioned how vegetarians/vegans tend to be young, female, liberal, and paradoxically somewhat high income and on food stamps.  After my talk a young women approached me and asked whether I knew if my participants were a part of the AmeriCorps program.  I said "no" - why?  She remarked that the characteristics I just described fit the people she knew who were AmeriCorp members.  I honestly don't know much about the program, but according to my questioner many of the members are young, recent college grads who tend to be liberal and who are often from relatively well-off families but who are encouraged by people in the program to sign up for SNAP (aka "food stamps").  

What did I find in this most recent survey?  Overall, 7.65% of the respondents said they were members of AmeriCorps.  And, overall, 5.6% of respondents said they were vegetarian or vegan.  So, how did my young questioner's hypothesis hold up?  Amazingly well!  Of the people who said they were a member of AmeriCorps, a whopping 40% said they were vegetarian or vegan!  By contrast, only 2.7% of non-AmeriCorps members said they were vegetarian or vegan.  Stated differently, of all the vegetarian/vegans in our sample, over 55% of them were a member of AmeriCorps.