Blog

Consumer Food Insights - October 2022

The results of our October 2022 Consumer Food Insights survey are now out.

With Thanksgiving right around the corner, we asked consumers about their plans for the holiday relative to last year. 81% of consumers either somewhat or strongly agreed that the price of turkey would be higher this year compared to last. It appears more people than not are expecting smaller gatherings and less travel this year, which perhaps explains (along with the higher price expectations) the result that fewer people than not are expecting to buy a larger turkey this year.

In terms of our overall tracking statistics, we found that food away from home (FAFH) spending declined for third month in a row. However, food at home (FAH) spending remains high and similar to that observed in the the past five months. Perhaps surprisingly, given the high rates of food price inflation, our measure of national food insecurity is at its lowest point of 2022 so far.

Speaking of inflation, my colleague Sam Polzin who manages the survey and data analysis, noted a remarkable correlation between consumers’ inflation expectations measured in our survey and gas prices, as shown in the figure below.

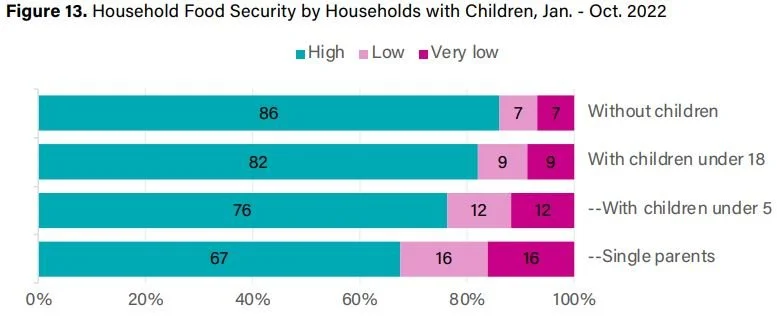
This month, we explored differences in our survey measures between household with and without children. Some of the largest differences were observed for food insecurity. Households with young children and single parents face highest rates of food insecurity.

Finally, we added some questions to compare with a recent Apollo Academic Survey conducted in collaboration with William Masters at Tufts University. That survey asked leaders, fellows, and awardees of the American Society of Nutrition and the Agricultural and Applied Economics Association (i.e., the experts) about their views on nutrition and policy. The survey of experts was motivated, in part, by an article in the Washington Post by Tamar Haspel in which she interviewed Will and me about our views on how to reduce the environmental costs of food production and consumption.

We thought it would be interesting to compare views of experts to those of the general public. The following two figures shows what the general public thinks about several health and nutrition issues. Will, Sam, and I are planning to write a separate piece doing a deep dive into the differences between experts and the public on these matters.

There is a lot more in the full report, which is available here.

Consumer Food Insights - August 2022

The latest edition of the Consumer Food Insights survey is now out.

In terms of the headline statistics, we saw a slight decrease in spending on food at home and a fall in consumers’ inflation expectations. Many of our other measures, including food insecurity, the sustainable food purchasing index, and food happiness remained steady.

Despite small changes in our headline numbers, this might be the most interesting report we’ve yet produced. We did a deep dive into how our various survey measures differ by political ideology, and we also asked a few questions about how people were experiencing and responding to the summer heat waves.

First, I want to highlight a general question we asked about budget stress. We asked people which three items were causing the most and which three items were causing least stress in their budgets (out of a set of 12 items). Then, we subtracted the percentage of times each item was picked as most stressful from the percentage of times each item was picked as least stressful to create a budget stress index that potentially ranges form -100 to + 100 for each item.

Which item causes the most stress? Food, followed by gas and rent/mortgage. The ranking is interesting in that it seems to reflect Maslow’s Hierarchy of Needs, and it highlights the prominent place that food plays in household financial well being. The result also helps explain why food price inflation has been a big topic of conversation over the course of the past year. The figure below shows these general trends and how they differ for people who said they were (or were not) affected by extreme heat this summer.

Overall, 65% of people said “yes” they had been affected by extreme heat this summer. For people who said “yes”, we followed up and asked how their behaviors changed in response to the heat. The figure below shows the results. Respondents said they spent less time working outdoors and shifted somewhat towards meals eaten at home as a response to heat.

In terms of political ideology, we noted some similarities between conservatives and liberals. In particular, liberals and conservatives tend to spend about the same amount of money on food (after adjusting for income) except at the highest income levels, and both liberals and conservatives report similar and very high levels of happiness with their diets.

Where do the differences come in?

  • Liberals indicate they’ve experienced less food price inflation over the past year and expect lower food price inflation in the future as compared to conservatives.

  • Liberals score more highly on the sustainable food price index, primarily because of the higher scores on (and higher weights placed on) environment and social issues as compared to conservatives. By contrast, conservatives score higher on economic and taste dimensions.

  • Liberals are about twice as likely to identify as vegetarian or vegan as compared to moderates and conservatives and are more likely to say they garden.

  • Conservatives are more likely to trust family, personal care physicians, friends, USDA, and food companies for information about food than liberals. The opposite is true of the FDA, New York Times, CNN, and Universities.

  • There are sizable differences between liberals and conservatives in terms of behaviors and beliefs about the food system. The figure below shows the break-down in terms of beliefs.

There is a lot more in the August report. You can read the whole thing here.

Consumers are taking note of inflation and worsening economic conditions

The July 2022 edition of the Consumer Food Insights (CFI) report from the Center for Food Demand Analysis and Sustainability (CFDAS) at Purdue is now out. A key take-away from this month’s findings is consumers’ buying behaviors are beginning to be affected by inflation and worsening economic conditions.

We repeated a question we asked back in February, which asked respondents to pick the top 3 answers that most reflected how they were responding to higher food prices. Back in February, the most common response (selected by 31% of respondents) was “little or no change.” In July, that figure fell nine percentage points to 22%. Now, the most common answer is “sought out more sales and discounts” followed by “switched to generic brands.” Whereas the “switched to generic brands” category was only selected by 13% of respondents back in February, in July it was selected by 22% of respondents.

Despite this finding, we are not yet seeing an uptick in food insecurity rates, and total food spending continues to rise.

This month, we did a deep dive into effects of education on food behaviors and attitudes. We find:

  • Food insecurity in 2022 is highest among those without any college education.

  • The most educated consumers report being most satisfied with their diets.

  • The importance of nutrition increases as consumers complete more years of college.

  • Gardening, vegetarianism, and recycling are most popular among those with a graduate degree.

Here’s how various food-system related beliefs vary by education.

A lot more is available in the full report.

Consumer Food Insights - June 2022

The June edition of the Consumer Food Insights (CFI) survey is now out. This month’s report is chock-full of interesting data and insights.

Here are a few highlights:

  • The Sustainable Food Purchase Index reached it’s highest level (70 out of 100) since our tracking survey began in January 2022.

  • Food spending continues to climb; this month the main increase is from spending on food away from home while spending on grocery was essentially flat.

  • Measured rates of food insecurity remain steady but there are some signs of belt-tightening among consumers, as there is an increase in price sensitivity and choice of generics over brands as well as an increase in food spending as a share of income for the lowest income consumers.

This month, we did a deep dive into impacts of age on consumer food behaviors and attitudes. There were significant age/generation gaps in several of our measures. For example, younger generations tended to place more important on environment and social issues when buying food compared to older generations.

It is also the case that food insecurity is highest among the younger households.

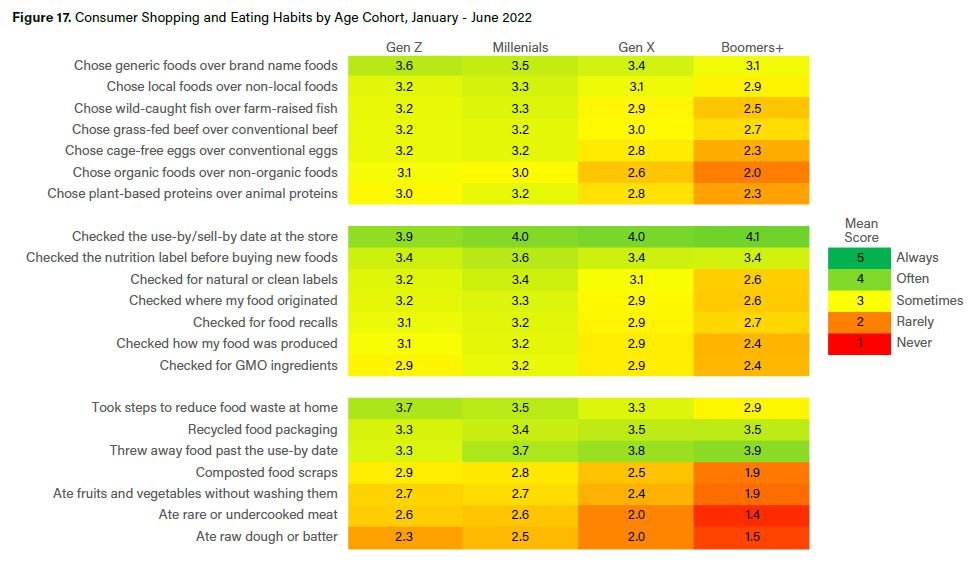
A corollary is that older consumers are more happy and satisfied with their food and diets than younger consumers. There are also differences in beliefs and purchase behaviors as the figure below illustrates.

Finally, we added a number of new ad hoc questions this month related to gardening, global food supply chain disruptions, and overall satisfaction with food issues relative to other issues in daily life. Seventy percent of respondents said they were worried or very worried about the Russia-Ukraine war affecting global food supplies; a smaller share, but still a majority (58%) thought the war had directly affected their food prices or availability. The most favored policy response was to increase U.S. food production.

There is a lot more in the full report. I encourage you to check it out at our Center for Food Demand Analysis (CFDAS) website.

Consumer Food Insights - April 2022

The April 2022 edition of our Consumer Food Insights report is now out.

A few highlights from this month:

  • The Sustainable Food Purchasing (SFP) index is up about 2 points since January

  • Consumer food spending fell slightly from March to April but remains about 9% higher than in January

  • Food insecurity rates are the lowest we’ve measured since the survey started

  • 46% of consumers have heard of the recent bird flu outbreaks; 60% are concerned about the impact on food prices

  • This month, we did a deeper dive into differences in behavior of urban vs. rural consumers. Rural consumers are more likely to be food insecure and are less happy with their diets as compared to urban consumers.

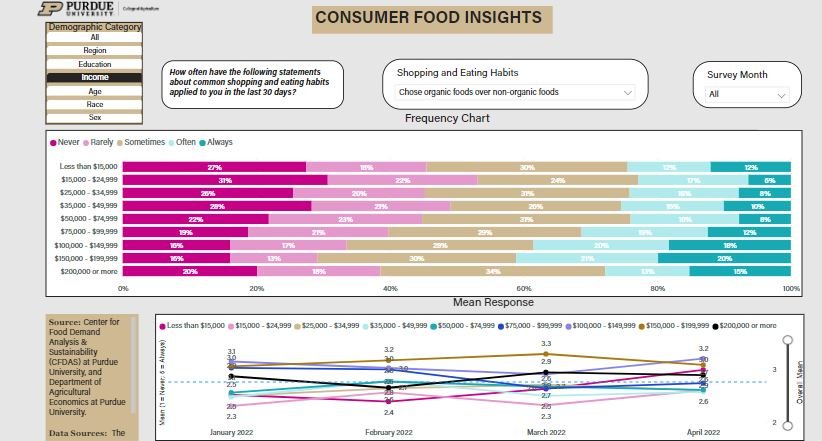
Finally, I’ll note that we’ve created our first data dashboard to explore current and past editions of the Consumer Food Insights survey. This dashboard focuses on the questions we ask about shopping and eating habits, and allows the user to see how these vary by demographic characteristics and by month of the survey. For example, the screenshot below shows propensity to buy organic food by income. Play around with the data yourself.

P.S. Kudos to Sam Polzin for his excellent work on the survey administration and reporting and to Anna Subramaniam for work on the data dashboards.