Blog

Consumer Food Insights - January 2023

The January 2023 edition of our Consumer Food Insights (CFI) survey is now out. This marks the 1 year anniversary of the inaugural edition of CFI, such that we can calculate year-over-year changes and now compare current estimates to the 2022 benchmark. Thanks to the members of the Center for Food Demand Analysis (CFDAS), particularly Sam Polzin, who have done a masterful job getting the survey out the door every month and expertly analyzing and reporting the results.

Given the new year, we asked respondents if they made any resolutions related to food and nutrition. About 1 in 5 said “yes.” All respondents were asked if they planned to make changes in their eating and exercising habits in the New Year. Here’s how people prioritized different activities.

Respondents said they planned to eat more fruits and vegetables, exercise more, and eat fewer snacks; they were least likely to say they would be eating less meat or growing their own food.

We ask a question every month about whether people were unable to find specific items when shopping. If someone says “yes” indicating a stock-out, which ask which items were missing. Below is the comparison from December to January. There was a dramatic increase in the number of people who said eggs were missing over this one month period over the same period egg prices spiked. Still, given that about 1,200 people take the survey, this implies only about (50/1200)*100 = 4.2% of respondents experienced an egg stock-out in January.

Our Sustainable Food Purchasing Index (SPI) remains fairly steady, but compared to last year, there is an improvement in taste, economic, security, and nutrition dimensions of sustainability. The environment indicator dipped a bit.

Consumers’ spending on food away from home (i.e., restaurants) has increased over the past three months and total food spending is up about 19% relative to the same time last year. There is an uptick in how much consumers say food prices have risen over the past 12 months, but they continue to expect lower rates of food price inflation for the future.

We find that our measured rate of food insecurity is essentially unchanged, although there is a dip in the share of households indicating that they have received free food from a food bank or food pantry this month.

This month we added some new questions on risk taking in different domains. On average people say they are not strongly risk averse (score of zero) or strongly risk loving (score of 10) - with an average score of 5.4. However, when asked the same question about their health, people are more conservative (average of 4.3). Median scores are also lower when asked about food consumption, suggesting people are less willing to take risk for health and food than for life in general.

With regard to stated food buying behaviors, we find a 9% reduction in the number of people who say they’re choosing plant-based proteins over animal proteins. This is consistent with the much discussed decline in sales of plant-based meat alternatives.

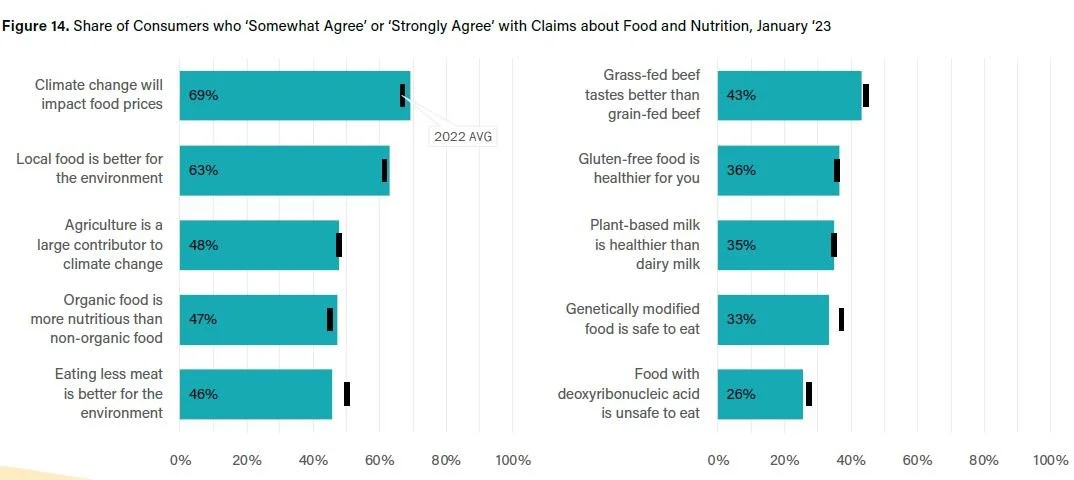
We observed some changes in consumers’ food and environmental beliefs. Fewer people today say GMOs are safe to eat or that eating meat is better for the environment than was the case last year.

Compared to last year, this month, we are seeing sizable increases in trust in food-related information from people’s personal physicians, the American Medial Association, and the Dietary Guidelines committee. Conversely, there were sizable declines in trust of food companies like Nestle, Tyson, and McDonald’s.

Finally, leading into the Farm Bill debate this year, I’ll leave this figure here indicating the degree of support/opposition for several food/ag policies (exact wording is in the full report).

The whole report is available here.

Consumer Food Insights - December 2022

The latest edition of our Consumer Food Insights (CFI) report from the Center for Food Demand Analysis and Sustainability (CFDAS) is now out. In this edition, we took a look back at the trends that have occurred over the first full year of the survey and explore some issues related to Holiday spending.

So, what changed over the course of 2022?

  • Food spending increased over 15% from the start to the end of the year; most of that increase happened in early summer and spending has been fairly flat for the past several months.

  • Consumers reported a rise in food prices paid over the course of the year; however, their expectations about future food price rises has fallen since June and reached a low in December.

  • Consumers are experiencing fewer stock-outs. Back in January, about 25% said they were unable to find specific products they wanted to buy at the grocery store. In December, the figure was only 14%.

  • There is a downward trend in online grocery shopping. Back in January 21% said they bought groceries online. By December, this figure had fallen to 15%.

  • In response to higher food prices, in December 22% of consumers said they were switching to cheaper brands, the highest percent recorded over the course of the year.

What hasn’t changed over the course of 2022?

  • Food insecurity rates have remained steady.

  • There is no noticeable trend in stated satisfaction or happiness with food.

  • Our Sustainable Food Purchasing (SFP) Index hasn’t much changed.

  • The share of consumers who reported being vegetarian or vegan is essentially flat.

  • Specific consumer shopping and eating habits remain steady. These included items like how often people choose cage-free over conventional eggs or choose organic over non-organic or choose local over non-local foods or check nutrition labels.

We added some questions specifically about Holiday spending (our survey was in the field just prior to Christmas). A little over a third of consumers (36%) said they were worried about affording holiday gifts. Of those who were worried, the most common stated response to how people were responding was more shopping at discount stores and spending less on gifts followed by spending less on restaurants and takeout.

Finally, in addition to our usual tracking questions, we added some questions about perceptions of treats to U.S. farm production and American well being as well asking questions about perceptions about effects of various actions on sustainability and well-being. Those results and more are available in the full report.

Consumer Food Insights - November 2022

The November 2022 results from our monthly Consumer Food Insights survey from the Center for Food Demand Analysis and Sustainability at Purdue University are now out.

As I discussed in my last post, despite the continuation of high food price inflation, our measures of food insecurity remain steady. Moreover, if we focus on a particular measure: whether more people are getting food from food banks, we also see no substantive uptick.

Broadly, we find that food at home (FAH) spending remain flat and is at roughly the same level as back in May despite continually rising prices since that time.

This month, we did a deeper diver into how consumer spending patterns, behaviors, and beliefs differed across geographic regions of the United States. We don’t yet have enough data at the state level to focus in at that granularity, so we looked at differences across the nine Census Regions across the U.S. (you can check out the map in our report to see which states fall in which regions).

We find that households closer to the coasts spend much more per week on food - both food at home (FAH) through grocery and food away from home (FAHF) through restaurants.

Despite greater food spending on the coasts (or perhaps because of it), households on the coasts are experiencing lower rates of food insecurity.

Intra-region differences in food behaviors demonstrate that broad geographic labels like Northeast vs. South are not terribly precise for comparing the food preferences of Americans.

As was the case last month, we added some new questions to compare with the recent Apollo Academic Survey conducted in collaboration with William Masters at Tufts University. That survey asked leaders, fellows, and awardees of the American Society of Nutrition and the Agricultural and Applied Economics Association (i.e., the experts) about their views on nutrition and policy. Our goal, down the road, is to compare views of experts to those of the general public.

We found Americans primarily blame reduced physical activity for the rise in national obesity rates and rank better access to healthy foods as their top policy priority for improving overall health. Using taxes to encourage healthier food consumption was the least popular option among the public.

There is a lot more in the report, which you can download here.


Trends in Food Insecurity

In recent months, we’ve experienced some of the highest rates of food price increases since the 1970s. Unless incomes have increased at a comparable rate (which they haven’t), higher food prices imply that consumers’ buying power over food has fallen. That is, consumers cannot afford to buy as much food today as they could in the past. Taken together, all this is reason to keep a close eye on what’s happening to food insecurity.

The official government measure of food insecurity comes out once a year. The most recent release was in October 2022 and corresponded to the year 2021. At that time, the USDA estimated 10.2% of U.S. households were food insecure at some point in 2021. Obviously a lot has happened since then - including a roughly 13% increase in grocery prices.

What is out best current estimate of food insecurity? Is it trending upward?

This is a statistic we’ve been tracking in our monthly Consumer Food Insights Survey we put out in the Center for Food Demand Analysis and Sustainability at Purdue. Despite the arguments above, we haven’t yet detected an uptick in food insecurity rates.

But, maybe something is “off” about out sample, survey, or analysis. Fortunately the Census Bureau started an ongoing “pulse survey” in the wake of the COVID19 disruptions, and they include some questions related to food security (they call their measure “food sufficiency”). Moreover, a few other groups have measured food insecurity rates over the past couple years.

My colleague Sam Polzin has done a masterful job brining together these and a variety of ofther measures of food security from different research groups over the past couple years in the form of a data dashboard that we plan to continue updating.

While there was perhaps an upward trend in food insecurity (or food insufficiency) around the end of last year and the first of this year, food insecurity rates have been fairly flat during most of 2022 (click here if you want to engage with an interactive version of the dashboard).

The result is a bit surprising given the aforementioned increases in food prices and the anecdotal accounts I’ve been hearing from folks working in food banks about being much busier than usual. It is possible that food insecurity hasn’t risen precisely because some of our safety nets have “caught” more vulnerable people and kept them out of food insecurity. For example, SNAP benefits increased in the wake of the pandemic (but are now being scaled back in some states). Still, even in our Consumer Food Insights survey, we are not seeing a trend in the share of people saying they’re getting food from foodbanks.

I’m all ears if someone has a good explanation for the disconnect between the multiple survey-based measures showing stable trends in food insecurity and the reports of longer lines at food banks.

Measuring sustainable consumer food purchasing and behavior

That’s the title of a new paper I’ve co-authored with Sam Polzin and Ahmad Wahdat that was just released by the journal Appetite. The paper explores and validates the sustainability-related measures used in our monthly Consumer Food Insights survey. A key result is that although sustainability experts often define the concept using multiple dimensions, consumers’ views are not as nuanced and are captured my a smaller number of indicators.

Here’s the abstract:

Consumer food purchasing and willingness to adopt a sustainable healthy diet (SHD) is a key factor affecting the sustainability of the entire food system. Studies have developed scales to measure consumer preferences for particular consumption patterns, while others have sought to empirically define the multiple dimensions of a sustainable food system (environmental, social, economic, etc.). This paper builds on these literatures by tracking consumers’ SHD behaviors using a large-scale, longitudinal survey of adults in the United States and mapping them onto multiple systems-level indicators. We wanted to know whether consumers interact with the sustainability of their food along the same principles developed by experts. Our study defines 18 food purchasing behaviors that support the sustainability goals of leading scientific institutions, uses factor analysis to identify the unobserved drivers behind these behaviors, and creates SHD scores to investigate their correlations with other consumer characteristics and behaviors. Factor analysis results show consumer food purchasing is motivated by three underlying sustainability dimensions—Economic Security, Socio-Environment, and Nutrition—which are fewer constructs than often defined by academic researchers. SHD scores reveal higher adoption of behaviors that fall under Economic Security relative to the other two dimensions. All three sustainability constructs are impacted by socio-economic and demographic characteristics.