Blog

USDA Economic Research Service

The president's latest budget proposal suggests the following: 

The Budget proposes to streamline the research efforts of the Economic Research Service by eliminating low priority research that is being conducted within the private sector and by non-profits and focusing on core data analyses in line with priority research areas. The Budget fully funds the anticipated needs for the release of the Census of Agriculture and provides a framework to better streamline the Department’s statistical functions, leverage administrative efficiencies, and focus on core data products similar to other statistical agencies elsewhere within the Government.

This budget document (page 69) proposes a significant 47.7% cut for the Economic Research Service (ERS) - from $86 million to $45 million.  

Of course this is just a proposal and may not be enacted, but the size of the proposed cut is sufficient to raise eyebrows.  This is particularly true for agricultural economics profession, which often relies on ERS for data, funding, leadership, and employment. 

If you're not familiar with the ERS, there is a good chance a google search about almost any important topic related food or agricultural economics will ultimately point you to their website (here is one summary of the agency by a former ERS administrator). 

Ever wonder how we know things like: the farmer's share of the retail dollar, or per-capita consumption of beef, or cost of producing corn, or how food prices will change next year or the price of broccoli, or how farm sizes and structure have changed over time, or whether US agriculture is more or less productive now than in the past?  If so, you can thank the ERS.  It is true that many university researchers also work on these topics and produce similar statistics, but the ERS often provides widely established benchmarks and "gold standards." 

If you want to see the kinds of things the ERS does, following their daily "chart of note" is a good place to start.
 

Who Says They Waste Food (and when)?

Applied Economics Perspectives and Policy just published a paper I co-authored with Brenna Ellison entitled "Examining Household Food Waste Decisions: A Vignette Approach."  Here is a summary of the paper:

The purpose of this research is to examine household (consumer) food waste decisions. Because measuring food waste is fraught with difficulty, our first contribution is the application of vignette methodology to the issue of food waste. Our second contribution is to systematically determine how decisions to waste food vary with factors such as price, location, cost of replacement, and freshness, among other factors. The empirical analysis is concentrated on specific food waste decisions: one focused on leftovers from a fully prepared meal and a second related to a single product (milk). The empirical results show that decisions to discard food are a function of consumers’ demographic characteristics and some of the factors experimentally varied in the vignette design.

In particular, each subject saw a description like the following (where they saw one of the values in each of the brackets): 

Imagine this evening you go to the refrigerator to pour a glass of milk. While taking out the carton of milk, which is [one quarter; three quarters] full, you notice that it is one day past the expiration date. You open the carton and the milk smells [fine; slightly sour]. [There is another unopened carton of milk in your refrigerator that has not expired; no statement about replacement]. Assuming the price of a half-gallon carton of milk at stores in your area is [$2.50; $5.00], what would you do? “Pour the expired milk down the drain” or “Go ahead and drink the expired milk”

I suspect you won't be too surprised to hear that "smell" had a significant effect on consumers' decisions to waste or not waste.  Apparently food safety considerations are one key driver of household food waste decisions.  

We also had another vignette surrounding the decision of whether to keep a leftover meal.  The findings?

In the case of meal leftovers, respondents were generally less likely to waste the leftovers when the meal cost was high, when there were leftovers for a whole meal, when there were no future meal plans, and when the meal was prepared at home. Many of these relationships have a very obvious time component. Leftovers can save individuals time when there is enough for a whole meal and there are no future meal plans; further, when a meal is prepared at home, there is already a time cost for that meal (albeit a sunk cost) that people do not want to discount by throwing the leftovers out.

Oh SNAP!

Multiple sources today reported an item in the president's budget that would replace a portion of the Supplemental Food and Nutrition Assistance Program (SNAP, aka "food stamps") with physical food deliveries.  Here is Politico

The proposal, buried in the White House’s fiscal 2019 budget, would replace about half of the money most families receive via the Supplemental Nutrition Assistance Program, also known as food stamps, with what the Department of Agriculture is calling “America’s Harvest Box.” That package would be made up of “100 percent U.S. grown and produced food” and would include items like shelf-stable milk, peanut butter, canned fruits and meats, and cereal.

The proposal is being pitched as a government version of Blue Apron that will save taxpayers hundreds of millions of dollars.  SNAP and consumer advocacy groups have expressed concern with the proposal; I haven't seen any overt advocates of the plan outside the administration.  

Economists have long favored unconditional (e.g., cash) to in-kind (e.g., food) transfers.  The basic idea is that an individual consumer has a better idea of what they'll like than an administrator deciding which foods to put in a box.  In other words, for the same budget, a consumer will be happier with cash than an equivalent dollar amount of food because the former provides more flexibility and freedom than the later.  This value of flexibility could, of course, be offset if the administrator could acquire foods at a substantially reduced price compared to the average food consumer.  But, this presumes the government administrators are more skilled in food acquisition than the Amazons, Walmarts, and Krogers of the world (or that these companies are taking in excess profits that could be passed directly to consumers).

There is another aspect to this issue that doesn't seem to be getting much attention.  In particular, at least for some people, it doesn't matter if you give them food or SNAP.  Here is Southworth writing in 1945 when earlier versions of SNAP were being debated:  

‘If a family would buy two pounds of beans anyway, giving it up to two pounds of beans as a consumption subsidy merely relieves it of the necessity of that much expenditure on its own behalf. In effect, its income is increased by the value of two pounds of beans, and it may spend some or none of this increased income on additional beans

In short, if a household already plans to buy beans, it doesn’t matter whether the household is given beans or an equivalent amount of cash – the final outcome is the same.

But, what if the household wanted rice and not beans?  Providing them beans means they are a little less happier than they would have been with an amount of cash (or SNAP benefits) equal to the beans that they then could use to buy rice.  

Maybe the idea is that this version of the SNAP program would be more beneficial to U.S. farmers. But, these aid programs are hardly efficient forms of farm support.  As I found in one analysis, for every $1 spent by taxpayers on SNAP, farmers benefit by only $0.01.  If the idea is to support farmers, we'd be better off just sending them the dollar.  

In the end, the purported benefits seem to hinge critically on the government's ability to deliver food at a price low enough that offsets the value of the loss of flexibility for the aid recipient.  

An unplanned shock to beef quality supply

In economics, it's tough to separate correlation from causation because the world is a messy place with lots of things changing at the same time.  As a result, empirical economists are always on the lookout for natural experiments, or situations where there was some random, unanticipated "shock" to the market that can help us get closer to an experimental setting, where we know a change in X was not due to a change in Y.  

I was reading through the latest edition of Meatingplace magazine, and was surprised to see a story about an event that provides precisely the sort of unplanned "shock" that we are always looking for. In particular, about eight years, ago, the USDA started using cameras (rather than people) to determine meat quality.  The two main quality grades are Choice (more marbled (or fattier), higher quality) and Select (leaner, lower quality).  

Apparently in June 2017, the USDA issued an update to USDA's camera grading system that "appeared to inaccurately assess the degree of marbling on some carcasses - allegedly grading some Choice that should have been Select." The USDA issued a new update to the cameras in October in 2017 to correct the problem. One analysis, quoted in the article, estimates that about 12,000 cattle were inadvertently graded Choice rather than Select (a 2.4% increase according to the article, if I'm reading it right).

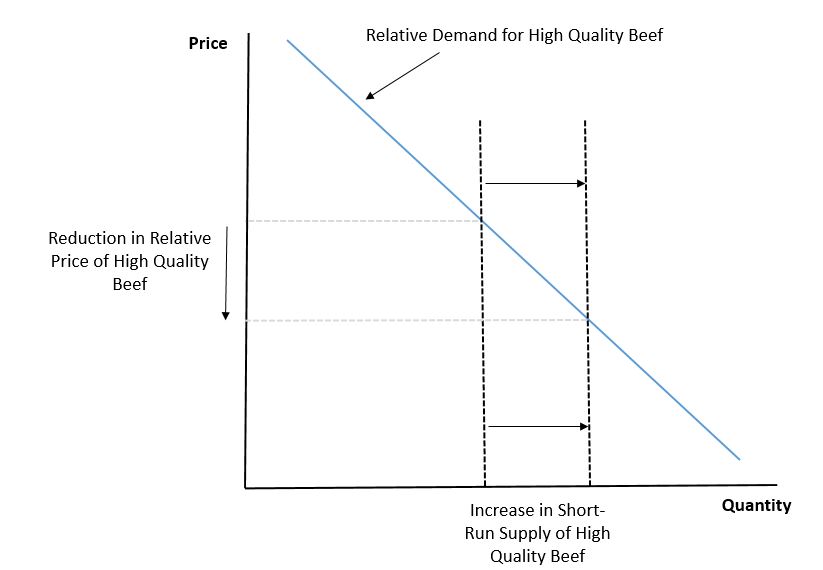
So, we have an unplanned, unanticipated "shock" to the beef quality market that shifted the supply of high quality meat and reduced the supply of lower quality meat.  This is illustrated by the two vertical lines in the figure (the lines are vertical because the supply is fixed in the short-run: you can't take Choice carcass and turn it into a Select one once the animal has been removed from feed).  If demand curve slopes downward, then this unanticipated increase in supply of Choice (and reduction in Select) quantity, should reduce the price premium for Choice over Select.  And in-fact, because the shock to supply is completely exogenous (it had nothing to do with demand but with a camera update), we should be able to use the natural experiment to estimate the slope of the relative demand curve for high quality beef (or the so-called elasticity of demand).  

choicetoselect2.JPG

Here is data from the USDA on the difference in price between Choice and Select beef, or the so-called Choice-to-Select spread, over the time period of interest (in particular, this is the difference in boxed beef cutout values measured in dollars per hundredweight - or cents per pound).    

choicetoselect.JPG

Just as one would expect, the increase supply of Choice relative to Select led to a reduction in the price premium charged for Choice relative to Select.  Of course, these raw data might be misleading - what if there is a seasonal pattern in which the Choice-to-Select spread falls every year from June to October?  To address this concern, I downloaded the last 10 years of data on the Choice-to-Select spread and found that the observed Choice-to-Select spread from mid June to late October in 2017 was $4.34/cwt lower than would be expected even after controlling for seasonality (month of the year), year, and a time trend.  This works out to about a 31% lower Choice-to-Select spread than would have expected during this time had it not been for the grading camera update (assuming there aren't other confounds I'm not controlling for).  

So, good news, it appears, the demand curves do indeed slope downward.  We can also go further if we take the aforementioned 2.4% change in quantity at face value that came from the Meatingplace article.  The price flexibility of demand (this is roughly the inverse of the elasticity of demand) for Choice (relative to Select) is given by the percent change in price over quantity, or -31%/2.4% = -12.9%.  So for every 1% increase in the quantity of Choice vs. Select supplied, there is a 12.9% reduction in the Choice-to-Select price spread.  

Factors Affecting Beef Demand

Glynn Tonsor, Ted Schroeder, and I recent completed a report for the Cattlemen's Beef Board on the factors influencing beef demand.  

One of the key factors that emerges from the analysis of the USDA price/quantity data is that beef demand appears to have become less sensitive to price-related factors.  In econ-lingo, beef demand has become more inelastic.  Moreover, changes in pork and poultry prices have fairly small impacts on beef demand.

As a result, we focused on several potential non-price demand determinants.  We find that emerging stories about climate change have adversely affected beef demand, but at the same time increased media focus on taste and flavor have more than compensated for those effects, pulling up demand since 2012.  

We also look at trends from the Food Demand Survey (FooDS) and how they relate to consumers' preferences and beliefs.  Here are some graphs on the relationship between a variety of factors and steak demand.

steak demand.JPG

Here is the same but for ground beef demand.

groundbeefdemand.JPG

Increases in income clearly increase steak demand, but ground beef is demanded similarly by all income categories.  Some of the biggest determinants of beef demand are "food values".  Here's what we have to say about how to interpret those results.

While it may not be initially obvious, results in figure 4.5 [showing the relationship between steak demand and food values] can be interpreted as providing evidence about people’s beliefs about (or perceptions of) steak. Suppose an individual highly values taste. Figure 4.5 shows that such an individual will tend to choose more steak. As a result, it must be that steak is perceived to be highly tasty. By this line of reasoning, figure 4.5 suggests that consumers, on average, perceive steak to be convenient, tasty, attractive, and novel but they also perceive steak to be poor for animal welfare, nutrition, and environment while also being expensive.

There's a lot more in the report.