Blog

What is a Foodie?

Merriam-Webster defines a foodie as, “a person having an avid interest in the latest food fads.” Wikipedia describes a foodie as “a person who has an ardent or refined interest in food, and who eats food not only out of hunger but also as a hobby.” According to the same source, the word originated in the 1980s and it is apparently some “food insiders” do not like.

Despite the fact the descriptor has been used with increased frequency over the past couple decades, it is not a concept or term I’ve seen analyzed in any depth in academic or industry circles, a phenomenon that is a bit strange given the rising interest in food and emergence of the “food movement.”

To delve into the concept a bit, I added a couple simple questions on a nationwide online survey of over 1,200 U.S. households I conducted about a year ago. I first asked, “Have you previously heard the term: "foodie"?” 87.1% said “yes” and 12.9% said “no.” For the people who said “yes.” I asked, “would you call yourself a “foodie””? 38.2% said “yes.,” 48.3% said “no,” and 13.5% said “I don’t know.” This means out of the entire adult U.S. population, about a third has heard the term “foodie” and considers themselves a “foodie.”

How do these self-declared foodies differ from the rest of the population? To answer this question, I compared the 463 people who had heard the term “foodie” and described themselves as one to the 585 people who had also heard the term but definitively said “no” they were not a foodie. Here are some of the biggest differences:

  • Foodies are younger. Of people who described themselves as a “foodie”, 35.4% are younger than 35 years of age; of people who said “no” they’re not a foodie, only 21.7% were younger than 35.

  • Foodies have higher education. Of people who described themselves as a “foodie”, 38% have a college degree compared to only 18.5% of non-foodies.

  • .Foodies have higher income. Incomes of foodies are about 12% higher on average than non-foodies.

  • Foodies are more likely to be vegetarian or vegan. 5.8% of foodies said they were vegetarian or vegan compared to only 2.2% of non-foodies.

  • Foodies are more likely to have children at home. 34.8% of foodies have a child under the age of 12 at home compared to only 16.8% of non-foodies.

  • Foodies are more likely to be politically liberal and be members of the Democratic party. Of people who described themselves as a “foodie”, 47.3% are Democrats compared to only 38.1% of non-foodies.

  • Foodies spend more money on food. Self-declared foodies spend about 45.8% more each week on food at home (i.e., through grocery stores) and about 18.8% more each week on food away from home (i.e., restaurants) than non-foodies.

There were not particularly large differences in region of residence (foodies are a bit more likely to live in the Southern U.S.), gender (foodies are a tab bit more likely to be male), or race (foodies are a bit more likely to be non-white).

We also asked people the extent to which they agreed or disagreed with various statements about food. Here’s the breakdown showing the mean response of each group on a 1 = strongly disagree to 5 = strongly agree scale.

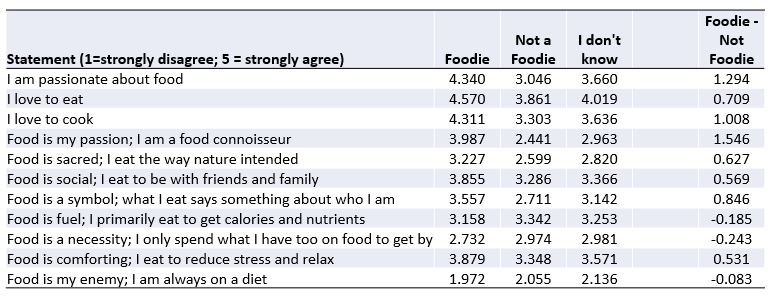
Foodies are more likely to agree that they are “passionate about food” and that they are “a food connoisseur.” They are slightly less likely to see food in utilitarian terms - viewing food as a fuel or as a necessity.

Previously, I mentioned foodies spend more on food, but perhaps that’s because they are also higher income? To explore this question, I estimated Engel curves that show how spending on food varies with income for both foodies and non-foodies. As the figure below shows, at any given income level, foodies spend more of their income on food than do non-foodies. This holds both for food at home and for food away from home.

It is also the case that at any given income level, foodies spend a higher share of their income on food at home vs. food away from home than non-foodies (note: these data were collected in February 2021, so results might be somewhat affected by COVID shutdowns).

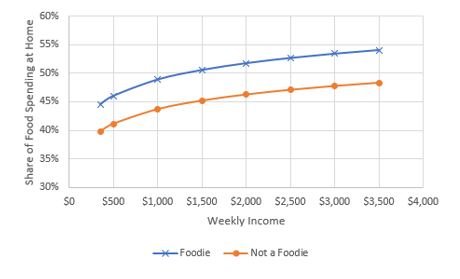
Taken together, the figures above suggest foodies are a highly relevant category of consumers for grocers - they spend more on food and a larger share of their income on food through grocery than do non-foodies.

Finally, we asked an open-ended question of people who had heard the term: “In a few words, describe a "foodie““ Here’s a word cloud constructed from the responses.

Consumer Food Insights - February 2022

I’m pleased to share the 2nd edition of our new Consumer Food Insights (CFI) survey (check here for more background and results from the inaugural release).

Overall, we observed a high degree of stability in a number of our measures including the Sustainable Food Purchasing Index, preferences for food policies, and food/diet happiness and satisfaction, and shopping behaviors. While it perhaps isn’t exciting to report little to no change in many of these measures, it does suggest reliability in our survey methods and points to the fact that we are getting at fundamental measures of consumer attitudes and behaviors that are stable across time. It also suggests that when we do observe significant changes in the future, we can be more confident that fundamental shifts are occurring rather than just picking up sampling error or spurious fluctuations.

We did observe an increase in consumers’ food price inflation expectations and a corresponding increase in consumers’ spending on food at home and away from home. Increasing inflation expectations are a bit worrisome because expectations of future price increases can lead to a self-fulfilling prophesy. That is, if consumers expect prices to continue rising, they ask and demand more compensation from their employers and clients, which leads to increased demand for goods and higher prices.

That said, it is interesting that consumers’ perceptions of how much food prices have increased over the past year is quite a bit lower than the official data on food price increases reported by the Bureau of Labor Statistics. The Bureau of Labor Statistics reported that prices of food at grocery increased 7.4% over the course of the past year (see our handy data dashboard on food price changes); however, the consumers in our survey said, on average, said they thought food prices had increased “only” 5.2% over the past year. Apparently consumers’ aren’t “feeling” inflation as much as the official data suggests. This may be a result of the fact that consumers can adjust to higher prices in a variety of ways by, for example, substituting to lower price alternatives or shopping on sale or at discount retailers.

When we directly asked consumers how they were responding to increased food prices, the most common answer (selected by 31% of respondents), was that they had made little to no change in their shopping habits, which suggests wage and income growth, coupled with savings, have not led to major shifts in consumers’ buying habits. The second most common answer, selected by 24% of respondents, was that they sought out more sales and discounts. Fewer than 1 in 10 said they searched for better prices online or spent less on other goods to maintain food consumption.

Through another ad-hoc question, we delved into mandatory GMO labeling. As of January 1st, 2022, certain foods that are genetically modified in a way that is not possible through conventional breeding are required to disclose that they are “bioengineered” or “contains a bioengineered ingredient.” Food companies can choose how they wish to disclose – either via a new symbol/label on the food product, through text on the food package, or through a QR code or phone number on a food package.

Given the newness of this policy, we were curious how food companies were responding and whether consumers were aware of the new disclosure requirements. Over two-thirds of respondents indicated that they have not seen the bioengineered label on food packages. Of that group, 87% had never seen the labels before, with the remaining 13% being familiar with the label but not yet encountering it in the store. Only 19% of consumers were sure they had seen the label in the store. Of this group, only 37% said they always check for it when shopping.

Impact of plant-based meat alternatives on cattle inventories and greenhouse gas emissions

That’s the title of a new paper just published in Environmental Research Letters I co-authored with Dan Blaustein-Rejto, Saloni Shah, and Glynn Tonsor. Here’s the abstract.

New plant-based meat (PBM) alternatives that aim to mimic the taste and texture of beef could have significant economic, environmental, and animal welfare impacts if they replace traditional animal-based meats and reduce livestock production. Whether PBM alternatives can achieve these ends depends on the extent to which consumers are willing to substitute for PBM alternatives, the structure of the meat industry, and the inter-linkages of the livestock industry with the other parts of the economy. We construct and calibrate an economic model to estimate how a reduction in PBM prices, or increase in demand for PBM, in the United States affects cattle production. For every 10% reduction in price or increase in demand for PBM, we estimate U.S. cattle production falls approximately 0.15%, U.S. cattle producers’ economic welfare falls by $300 million year per year, and U.S. consumer welfare rises by $513 million year per year. Key variables affecting model outcomes include the supply elasticity of cattle, the share of the total cost of cattle used to produce ground beef, and cross price-elasticity of demand between PBM and ground beef. Increases in U.S. demand for PBM alter trade patterns, leading to a reduction of beef imports and an increase in beef exports, a phenomenon that further reduces global greenhouse gas emissions and land use given the relative efficiency of U.S. beef production. For every 10% reduction in the price of PBM alternatives, we estimate that the global reduction in emissions is equivalent to 0.34% of U.S. emissions from beef production and 1.14% when including reduced land-use change emissions. Even substantial reductions in prices of PBM alternatives are unlikely to have substantive impacts on the U.S. cattle population and emissions, suggesting the need to also pursue alternative mitigation strategies, such as innovations to reduce the methane emissions per head.

As indicated, the modeling results are partially driven by the relatively low cross-price elasticity of demand between plant-based meat alternatives and traditional meat that we have found in previous studies, mainly based on surveys. I just ran across this new paper in the Journal of Economic Perspectives and Policy by Shuoli Zhao, Lingxiao Wang, Wuyang Hu, and Yuqing Zheng that estimates these cross-price elasticities using grocery store scanner data based on actual purchase histories. They find, surprisingly, that plant-based and traditional meet are demand complements rather than substitutes. This would mean that a fall in plant base meat alternative prices would lead to an increase in the quantity of beef demanded! (note: the estimated effect is small - a 1% reduction in plant-based prices would lead to a 0.003% increase in beef demand). They find only chicken is a demand substitute for plant-based meat alternatives. Thus, the Zhao et al. paper re-enforces our finding that a reduction in plant-based meat alternative prices is likely to have very small impacts on U.S. cattle inventory - at least based on current preferences and current market structure.

You can read our new paper here.

What's the Price of Milk?

The excellent team at the new Center for Food Demand Analysis and Sustainability (CFDAS) has just pulled together a new dashboard illustrating data on the prices of more than 50 food and beverages items over time (underlying data come from the Bureau of Labor Statistics). Click on a food, and the dashboard shows the price of of the food over time in nominal terms, switch over to another tab and the same price trend will be shown in inflation-adjusted terms, or switch over to the final tab and see the time-price of the food. The time-price is the amount of the food that can be bought with an hour’s worth of work given the average wage rate (also measured by BLS) at the time the price was measured.

Check out the dashboard here.

Oh, and if you’re wondering, the price of milk was $3.74/gallon in December 2021 (the most recent data available from BLS). And, a worker at the average wage in December 2021 could buy 8.39 gallons of milk with one hour of work.

Launch of Consumer Food Insights

I’m pleased to share the results of a new, monthly survey of U.S. food consumers, we’ve named Consumer Food Insights. Consumer Food Insights is a monthly survey of more than 1,200 Americans from across the country, and it is the one of the products of the new Center for Food Demand Analysis and Sustainability (CFDAS) that we launched this fall. With the survey, we seek to better understand changes in our national food environment and help businesses navigate their supply chains. Consumer Food Insights reveals where, how, and what food U.S. consumers bought and ate, with a focus on the implications for food systems at the national scale.

One set of questions aims to track self-reported sustainability of food purchases along five different dimensions.

There are many cool insights from the new survey, and you can read a summary of this month’s results here. Some highlights from this month’s survey include:

  • 21% purchased their last groceries online

  • 32% are waiting for their next paycheck to buy groceries again

  • 16% are food insecure

  • 46% ate home-cooked meals 4-6 times per week

  • 11% identified as a vegetarian or vegan

  • 25% unable to find a specific food product at the grocery store, most commonly listing items like chicken, beef, dairy, and bread products

  • 87% said they’re happy with the food their diet

  • Food spending averaged $158/week.

Some of the additional measures we’ll be tracking every month are illustrated below.

and

We will also be adding timely questions in response to ongoing events. This month, we added a question related to perceived causes of the increases in meat prices over the past year. Of note, market concentration in the meat packing industry has received national media attention in recent months. The Biden administration argues that industry consolidation is partly responsible for climbing grocery prices. What do consumers think? As indicated below, a relatively small percentage of respondents attributed high prices at the store to concentration and market power. A majority of respondents (51%) blamed COVID-related shutdowns for the increase in meat prices over the last year, but the top five causes also included labor shortages across supply chains, higher prices for animal feed, higher energy prices, and higher wages across supply chains.

There’s a lot more, including links to the underlying methodological details, available here.

Are you interested in additional analysis or adding questions to the survey?  Consider joining our consortium of Consumer Food Insights members.

************

P.S. This new survey effort is designed to complement the ongoing Meat Demand Monitor (MDM) that Glynn Tonsor is running at Kansas State, and it is a follow-up to and evolution of the Food Demand Survey (FooDS) project I ran from 2013 to 2017.