Blog

Food prices - A prediction for retail beef prices in 2024 and 2025

Earlier this week, the Bureau of Labor Statistics released their monthly inflation statistics, and food prices continued their climb.. For example, grocery prices increased 13.5% in August 2022 compared to the prior year in August 2021 (see our data dashboard if you want to do a deeper dive yourself). The question everyone wants to know is: how long will this continue?

Truth is nobody really knows and many economic prognosticators were suggesting overall inflation (the rate of increase in food plus non-food prices) would fall in August, when in fact the pace of price increases slightly increased.

Predicting the future is hard. Nonetheless, I’m going to step out on a limb and make a specific prediction. I’m suggesting one should expect higher beef prices a couple years from now.

Why? Well, drought and higher feed prices across the U.S. are making it difficult for farmers and ranchers to hold on to their breeding stock (i.e., cows and heifers). Here' is Josh Maples at Mississippi State University in his latest newsletter:

Regionally, cow slaughter in the Southern Plains is much higher than in 2021 where drought has been a major factor. Region 6 consists of Arkansas, Louisiana, New Mexico, Oklahoma, and Texas and beef cow slaughter in this region is about 30 percent higher year-to-date in 2022 than in 2021. That is more than 150,000 head higher than a year ago in this region. These are very high levels of cow slaughter and even surpass the high slaughter totals seen during the 2011 drought.

He goes on to write:

While increased cow and heifer slaughter totals are contributing to higher beef production this year, the longer-run implications are tighter supplies. The higher slaughter totals imply fewer cows and fewer replacement heifers to produce calves.

Fewer calves in 2022 and 2023 means there will be fewer cattle and ultimately less beef in 2024 and 2025. If a cow is bred today, it’ll be 9 months till a calf is born. The calf stays with its mama for 6-12 months till weaning. Then, the calf moves to the “stocker” or “background” phase, where it eats grasses and forages for about a year. Finally, most cattle in the U.S. then move into a feedlot for the final three to six months. Put it all together, the decisions being made TODAY to sell cows and heifers will have impacts on retail beef prices TWO to FOUR years from now (check out this nice podcast discussion between James Mitchell and John Anderson at University of Arkansas for more discussion on the issue).

So, two to three-ish years from now, the period of drought and high feed prices we are now experiencing, will lead to less beef being put on the market. This means 2024 and 2025 beef buyers will have to compete against each other for a smaller quantity of beef on the market, driving up prices.

Another reason, we can be semi-confident in this sort of outcome, is that we can look back just a decade ago and see the same thing played out. The figure below shows retail beef prices. Aside from the recent COVID-related wackiness we’ve seen in beef prices, the last time we had a run-up in retail beef price was in the 2014 to 2015 period (the period shaded in grey below).

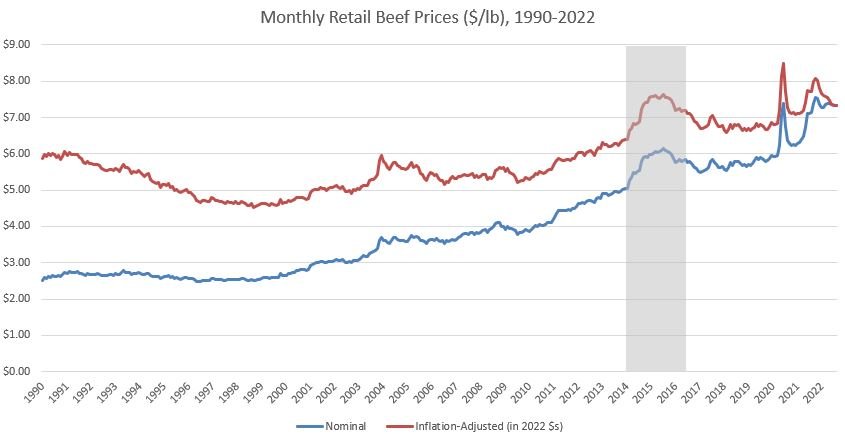
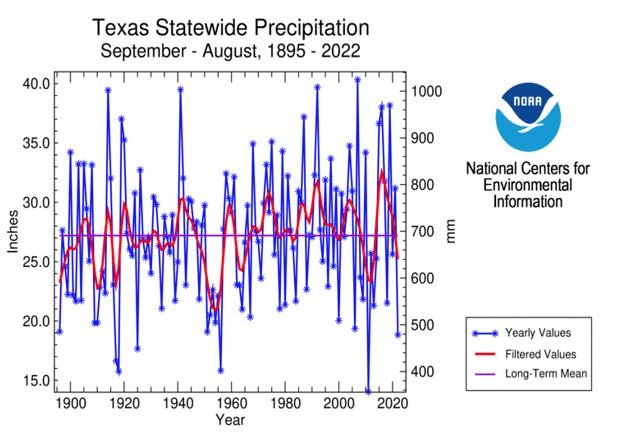
Well, what was happening two to three years prior to to the run-up in beef prices in 2014? You guessed it: drought and high feed prices. I said as much on this blog in March 2014 and again in July 2014 (I suppose that’s one advantage of blogging now for almost a decade!). If you want more proof, check out this graph from the National Centers for Environmental Information showing August-September precipitation in Texas (a major cattle state) over time. As you can see, 2011 had one of the lowest precipitation points on record.

So, write it down: we’ll almost surely see higher retail beef prices in two to three years than we’re seeing today. I’ll be happy if I’m proven wrong.

Another prediction? In a couple years, per-capita beef consumption in the U.S. will fall. As I discussed when this last happened, though, the reason probably won’t be primarily due to higher rates of vegetarianism or heightened concern about animal welfare or the environment or new plant-based substitutes, but the drought-induced liquidation that we are now observing.

Consumer Food Insights - August 2022

The latest edition of the Consumer Food Insights survey is now out.

In terms of the headline statistics, we saw a slight decrease in spending on food at home and a fall in consumers’ inflation expectations. Many of our other measures, including food insecurity, the sustainable food purchasing index, and food happiness remained steady.

Despite small changes in our headline numbers, this might be the most interesting report we’ve yet produced. We did a deep dive into how our various survey measures differ by political ideology, and we also asked a few questions about how people were experiencing and responding to the summer heat waves.

First, I want to highlight a general question we asked about budget stress. We asked people which three items were causing the most and which three items were causing least stress in their budgets (out of a set of 12 items). Then, we subtracted the percentage of times each item was picked as most stressful from the percentage of times each item was picked as least stressful to create a budget stress index that potentially ranges form -100 to + 100 for each item.

Which item causes the most stress? Food, followed by gas and rent/mortgage. The ranking is interesting in that it seems to reflect Maslow’s Hierarchy of Needs, and it highlights the prominent place that food plays in household financial well being. The result also helps explain why food price inflation has been a big topic of conversation over the course of the past year. The figure below shows these general trends and how they differ for people who said they were (or were not) affected by extreme heat this summer.

Overall, 65% of people said “yes” they had been affected by extreme heat this summer. For people who said “yes”, we followed up and asked how their behaviors changed in response to the heat. The figure below shows the results. Respondents said they spent less time working outdoors and shifted somewhat towards meals eaten at home as a response to heat.

In terms of political ideology, we noted some similarities between conservatives and liberals. In particular, liberals and conservatives tend to spend about the same amount of money on food (after adjusting for income) except at the highest income levels, and both liberals and conservatives report similar and very high levels of happiness with their diets.

Where do the differences come in?

  • Liberals indicate they’ve experienced less food price inflation over the past year and expect lower food price inflation in the future as compared to conservatives.

  • Liberals score more highly on the sustainable food price index, primarily because of the higher scores on (and higher weights placed on) environment and social issues as compared to conservatives. By contrast, conservatives score higher on economic and taste dimensions.

  • Liberals are about twice as likely to identify as vegetarian or vegan as compared to moderates and conservatives and are more likely to say they garden.

  • Conservatives are more likely to trust family, personal care physicians, friends, USDA, and food companies for information about food than liberals. The opposite is true of the FDA, New York Times, CNN, and Universities.

  • There are sizable differences between liberals and conservatives in terms of behaviors and beliefs about the food system. The figure below shows the break-down in terms of beliefs.

There is a lot more in the August report. You can read the whole thing here.

Animal Welfare vs. the Environment

Global population is projected to reach 9 billion by the year 2048. Increased global affluence will result in an increase in global protein requirements per capita. With more people wanting to consume meat, production of animal protein will need to increase by 70% from 2005 to 2050. Increased global demand for animal protein has the potential to exacerbate environmental problems associated with climate change and biodiversity loss. Meat-containing diets worldwide have been estimated to require 6 times more land than wheat-based diets, calling into question the ability of animal agriculture to efficiently meet growing caloric needs. One potential way to meet protein demand while mitigating environmental damages is to intensify animal agriculture, which can reduce the environmental impact per unit of food produced. However, intensification practices (e.g., battery cages, gestation crates, feedlots) are often argued to decrease farm animal well-being.

That’s from the opening paragraph of a recently released a paper I co-authored with now PhD student, Jacob Schmiess in The Journal of Agricultural and Resource Economics (references removed for clarity).

Jacob and I invested this issue from the consumers’ point of view by looking at the tradeoffs consumers were willing to make between different attributes when buying ground beef with different environmental and animal welfare characteristics and claims. We surveyed over 1,500 consumers who were randomly assigned to choices that varied by how the welfare and environmental outcomes of beef were communicated (text only, text+visual cues, or via label claims) and by what information was presented to respondents (none, pro-welfare, or pro-environment).

Here is a summary of our results excerpted from the paper:

Across all presentation designs and information treatments, participants are far more willing to pay for animal welfare attributes than for environmental efficiencies. The three attributes representing animal welfare (particularly grassfed and AGH [added growth hormone] free) elicited higher overall WTP [willingnes-to-pay] than the three attributes representing environmental sustainability. Results indicate that [presentation format] can have a significant impact on consumer responses. Participants shown the purely informational presentation (text design) disregarded all numerically presented attributes (land use, water use, CO2 emissions, mortality rate). Instead, they chose options solely on price and whether the beef was grassfed with no AGH. The visual presentation incorporated color and size to illustrate the numeric attributes more intuitively. This group had significantly higher WTP for environmental attributes than those in the other presentations, although still lower than their WTP for animal welfare attributes. The label presentation was designed to more realistically mimic a grocery store setting, using images of packages of ground beef with labels representing each attribute besides price. Participants shown the label design had the lowest variance across attributes for WTP and relatively lower attribute WTP overall. Somewhat surprisingly, the land protection certified label produced slightly higher WTP than the grassfed label.

The use of pro-animal welfare information in the text design produced a significant increase in WTP for animal welfare attributes as well as lower preference for [beef overall]. Pro-environment information had no effect on any design.

In the label design, participants’ WTP for a meat option over a “purchase neither” option was 1.5–2 times higher than that of participants the other designs. This group was also the most heavily influenced by price and had relatively low attribute WTP overall. One potential reason for this is that the label design does not display a “less desirable” level of each attribute, only the absence of a desirable label. It is possible these labels are seen as bonuses to an already desirable product rather than as a better alternative to an explicitly “undesirable” quality.

You can read the whole thing here.

Consumers are taking note of inflation and worsening economic conditions

The July 2022 edition of the Consumer Food Insights (CFI) report from the Center for Food Demand Analysis and Sustainability (CFDAS) at Purdue is now out. A key take-away from this month’s findings is consumers’ buying behaviors are beginning to be affected by inflation and worsening economic conditions.

We repeated a question we asked back in February, which asked respondents to pick the top 3 answers that most reflected how they were responding to higher food prices. Back in February, the most common response (selected by 31% of respondents) was “little or no change.” In July, that figure fell nine percentage points to 22%. Now, the most common answer is “sought out more sales and discounts” followed by “switched to generic brands.” Whereas the “switched to generic brands” category was only selected by 13% of respondents back in February, in July it was selected by 22% of respondents.

Despite this finding, we are not yet seeing an uptick in food insecurity rates, and total food spending continues to rise.

This month, we did a deep dive into effects of education on food behaviors and attitudes. We find:

  • Food insecurity in 2022 is highest among those without any college education.

  • The most educated consumers report being most satisfied with their diets.

  • The importance of nutrition increases as consumers complete more years of college.

  • Gardening, vegetarianism, and recycling are most popular among those with a graduate degree.

Here’s how various food-system related beliefs vary by education.

A lot more is available in the full report.

What Caused the Increase in Pork Prices?

That’s the question Glynn Tonsor and I tried to answer in a recent report we prepared for the National Pork Board. From January 2020 to May 2022, retail pork prices increased over 27%. Why? The figure below summarizes our assessment.

From the executive summary:

Several factors contributed to the 6.3% increase in consumer willingness-to-pay for pork. Analysis suggests that changes in the prices of beef and chicken relative to pork are probably not major drivers of the increased willingness-to-pay for pork. Rather, a more likely driver behind increasing pork demand is strong consumer food spending, buoyed by federal stimulus and COVID-19 relief payments.

A number of factors contributed to the estimated 45.6% increase in marginal costs of pork production. These include: 1) Significantly higher feed costs. Inflation-adjusted corn prices increased 79% from January 2020 to April 2022, and soybean meal prices increased 42% over the same period. 2) Fuel and transportation costs have escalated. Real gasoline and diesel prices are about 48% higher than in January 2020, and refrigerated trucking rates were up about 50% at the first of 2022. 3) Wages in packing and retailing have outpaced inflation, pushing up pork prices.

For the economists out there, the approach we used to quantify the price increases is one that could be readily applied in a variety of other contexts. If one knows the change in price and quantity and is willing to make assumptions about the elasticities of supply and demand, then it just takes a bit of algebra to decompose a price change into the portion arising from demand factors and the portion arising from supply factors.

There is a lot more in the full report, which is available here.