Blog

Meat Demand in an Era of High Prices

The journal Applied Economic Perspectives and Policy just accepted a paper I've written with Glynn Tonsor, which provides new estimates of consumer demand for different meat products using what is probably one of the largest and longest-running surveys choice experiments (a survey method) to date.  

The graph below showing changes in retail meat prices from January 2010 to January 2015 is  what motivated the paper. Beef and pork prices rose dramatically over this period (note: in the past few months they've come back down) whereas chicken prices were and still are fairly stable.   The following is further motivation from the paper:

Industry observers have expressed surprise about how consumers have responded to recent price changes (Ishmael, 2014). In particular, expenditures for beef and pork have not fallen as much as some people expected given the high prices. Industry analysts have asked “where is the tipping point” when consumers will stop buying beef and pork (Rutherford, 2014), but it may be that demand elasticities are more non-linear than previously realized. Moreover, relative price swings would have seemed to have favored chicken over beef and pork, and yet there does not seem to be a high degree of substitution in the current market environment. Such observations raise the possibility that cross-price elasticities have changed or are lower at higher price levels.

You can read the paper for the methods.  Here I'll just highlight what we found.

First, people with different incomes choose different things.  High income consumers are more likely to choose steak and chicken breast than are low income consumers, and the opposite is the case for chicken wings, ground beef, and deli ham.  

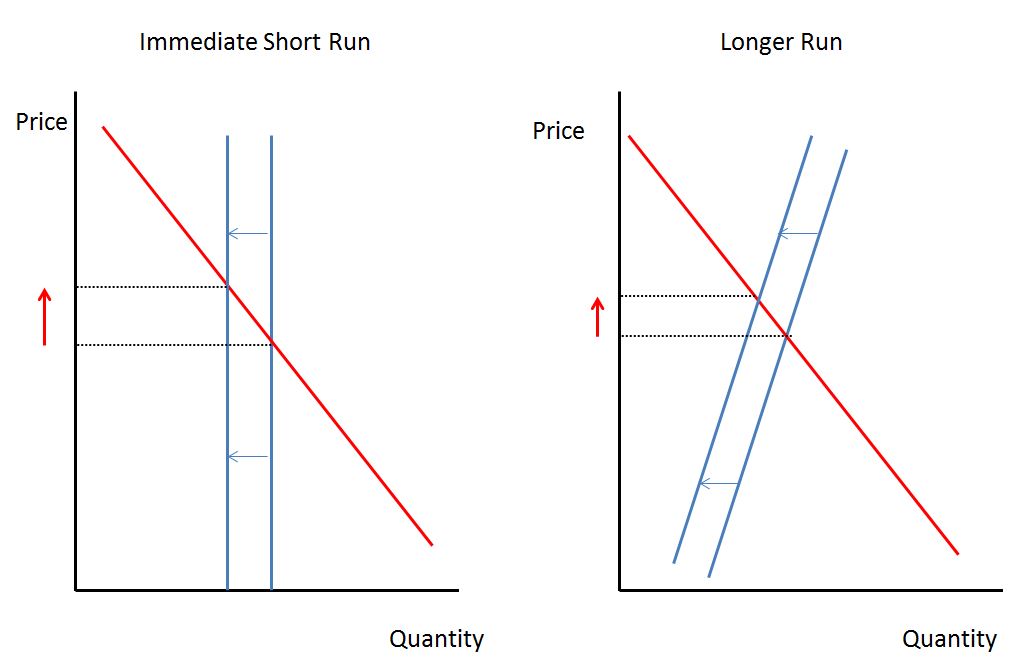
Second, beef prices are more sensitive to changes in the price of chicken than the reverse.  Here's an illustration of that phenomenon using our estimated model for middle income consumers.

Third, and somewhat surprisingly (though consistent with industry observations over this period), the quantity of beef and pork demanded is less sensitive to price changes when prices are high as compared to when prices are low.  In econ-jargon, demand is more inelastic as prices rise.  You can see that in the graphs above, and the paper fleshes out that finding a bit more by showing the bias in models that ignore this non-linearity in demand. 

Hopefully these new estimates will help us better predict in the near future what happens when beef and pork prices fall, and will help producers better anticipate the impacts of future price hikes.

This analysis used a huge data set (110,295 choices made by 12,255 consumers) collected over a year and half long period.  This is of course from my Food Demand Survey (FooDS).  The present analysis assumed people's preferences staid the same over this period.  Up next on the research agenda is to look at how these demand estimates have been changing (or not) over time using even more data over a longer time period., and investigating whether these survey-based demand changes can forecast changes in retail meat prices.   

Price impacts of avian influenza (bird flu)

Since the last time I posted on the issue, avian influenza has continued to spread, particularly in flocks of egg-laying hens, and the price impacts are becoming more apparent. 

Here's what I wrote back in April:

Demand for eggs is likely much more inelastic [than turkey] because of fewer substitutes. The elasticity of demand for eggs is probably somewhere around -0.15 to -0.20. The USDA-APHIS data indicates that about 4 million chickens (I believe these are egg-laying chickens) have been killed due to the flu. There are about 300 million laying hens in the U.S., implying this is a supply reduction of about 1.3%. Following the same logic as before, a 1.3% supply shock in the short run would cause a (0.013/0.15)*100=8.7% increase in egg prices in the immediate short run. Why so much higher than for turkey? Because demand for eggs is likely more inelastic than is demand for turkey. If the outbreak in egg laying hens doubles, reducing supply by 2.6%, that would imply a price increase of 17.3% in the short run.

Now, here's what Kelsey Gee wrote in the Wall Street Journal just yesterday:

Avian influenza has resulted in the deaths or extermination of at least 38.9 million birds, more than double the previous major U.S. outbreak in the 1980s. Of that total, more than 32 million are egg-laying hens, accounting for about 10% of the U.S. egg-laying flock.

The wholesale price of “breaker” eggs—the kind sold in liquid form to restaurants like McDonald’s Corp., food-service supplier Sysco Corp. and packaged-food producers—nearly tripled in the past month to a record $2.03 a dozen on Thursday, according to market-research firm Urner Barry. Meanwhile, U.S. prices for wholesale large shell eggs, those sold at the grocery store, have jumped about 85% to $2.20 a dozen in the Midwest.

The actual price impacts aren't that far off from what were predicted from my very simply supply/demand model.  In the very short run, supply is predetermined, so the price impacts of a reduction in supply are determined entirely by the shape of the demand curve.  A very simple demand curve is Q = e*P, where Q is the proportionate change in quantity, P is the proportionate change in price, and e is the own-price elasticity of demand.  Changes in price are thus given by: P=Q/e.  

Thus, if the change in quantity is about -10% as indicated in the WSJ article, and the elasticity of demand is about -0.15 as I previously suggested, the expected short-run price change is P = 0.1/0.15 = 0.667, or a 66.7% increase.  

The 85% price increase cited in the WSJ is larger than the projected 66.7% increase.  This could be because consumer demand for eggs has fallen among some consumers worried about bird flu (see my recent survey for evidence on that), so we may be witnessing not only movements along the demand curve but also a shift in the demand curve.  Or, it could simply be that demand for eggs was more inelastic that I previously assumed.  An own-price elasticity of egg demand of -0.117 rather than -0.15 would imply an 85% price increase in response to a 10% reduction in quantity supplied.  

But, no matter the cause of the price increases, it certainly isn't good for consumers who are harmed by having to pay higher prices for a smaller number of eggs. Producers who have lost flocks are certainly worse off.  The only beneficiaries are those egg producers who've (at least so far) avoided the outbreak.  

Are consumers really spending more on food away from home?

A couple days ago, the Wall Street Journal ran a story that started as follows

Retail-sales figures released by the U.S. Commerce Department garnered considerable attention last month when news reports suggested they showed Americans spent more money dining out than buying groceries for the first time ever.

Some observers jumped from there and attributed the shift to the growing clout of millennials, saying they prefer breaking bread with friends at restaurants, while sad-sack baby boomers who didn’t save enough for retirement are stuck cooking at home.

But as it turns out, reports on the decline of home cooking were half baked. They demonstrate, once again, that it is important to understand how the government compiles statistics to avoid jumping to conclusions the figures don’t support.

I agree.

As the story points out, the government's data ignores sales from some major grocery establishments like Wal-Mart.

This is an issue we've been tracking in the Food Demand Survey (FooDS) for over two years now.  Our data from a nationally representative sample of consumers show it's not even close.   People spend a lot more money on food at home.  Here's the data from our second annual report.

Our most recent release, just a couple days ago shows at home consumption at about $96/week and away from home at about $53/week.  

Thus, our data clearly supports the conclusion drawn by Jo Craven McGinty in the WSJ:

The government’s monthly retail-sales report provides valuable information that reveals legitimate trends, providing users understand what the numbers represent.

In this case, no matter how you slice it, spending on dining out hasn’t surpassed spending on groceries

How will avian influenza (bird flu) affect egg and turkey prices?

I was asked to make an appearance on Fox Business with Neil Cavuto this afternoon to talk about the impacts of the avian influenza (aka bird flu) outbreak on food prices.  I had a couple other commitments that prevented me from going on air, but I'll share a few thoughts on the matter here via the lens of ECON 101.

When a farm encounters a case of the bird flu, some birds die and others are euthanized.  This reduces the supply of birds.  In the graph below, this shifts the supply curve (the blue line) to the left.  In the immediate short run, this translates into a direct reduction in the amount of turkey or eggs on the market as the supply curve is perfectly inelastic.  

Consumers are now left to bargain over less quantity, and the shape of the demand curve (the red line) determines how high prices will rise.  The more inelastic the demand curve (the less price responsive are consumers), the greater the price increase.  In the longer run, the industry can adjust by adding new breeding stock, new houses, etc. (this makes the supply curve upward sloping rather than perfectly inelastic as shown in the right-hand graph), so the ultimate price effects will dampen over time.  


This simple economic framework can be put to use to calculate possible impacts.  According to data from USDA-APHIS, there have been around 3.3 million turkeys lost due to the flu.  There are about 240 million turkeys in the nation.  So, this represents a loss of about 1.4% of the turkey supply (this is the size of the supply shift in the quantity direction expressed in percentage terms).  Assuming the elasticity of demand for turkey is about -0.5, this would imply that we could expect a (0.014/0.5)*100=2.8% price increase in the immediate short run.  If the longer-run supply elasticity is, say, 0.8, the the longer-run price increase resulting from this supply reduction would be only (0.012/(0.5+0.8))*100=1.07%.  What if the outbreak grows in size and doubles?  Such that 6.6 million turkeys die?  This would be a 2.8% reduction in supply which would cause a (0.028/0.5)*100=5.6% short-run increase in turkey prices.

Demand for eggs is likely much more inelastic because of fewer substitutes.  The elasticity of demand for eggs is probably somewhere around -0.15 to -0.20.  The USDA-APHIS data indicates that about 4 million chickens (I believe these are egg-laying chickens) have been killed due to the flu.  There are about 300 million laying hens in the U.S., implying this is a supply reduction of about 1.3%.  Following the same logic as before, a 1.3% supply shock in the short run would cause a (0.013/0.15)*100=8.7% increase in egg prices in the immediate short run.  Why so much higher than for turkey?  Because demand for eggs is likely more inelastic than is demand for turkey.  If the outbreak in egg laying hens doubles, reducing supply by 2.6%, that would imply a price increase of 17.3% in the short run.  

There are a couple reasons to suspect these effects may be overstated.  First, exporters have slowed imports of chickens, turkey, and eggs because of the outbreak of the bird flu.  That means domestically - within the U.S. - we'll have more supply on the market because not as much is going out of the country.  Larger domestic supplies will mean downward pressure on  domestic prices that push against the effects of the initial supply shock (although it should be noted that either way, world prices will rise).  Second, the above analysis ignores substitutes.  Higher turkey and egg prices will cause people to substitute toward beef and pork, which will have feedback effects on turkey and egg prices.  


Farm size and community prosperity

Darby Minnow Smith in an article for Grist writes:

As the total number of farms goes down, the number of big* farms is going up — and this shift hurts rural America. According to an analysis by Food and Water Watch: “Communities with more medium- and smaller-sized farms have more shared prosperity, including higher incomes, lower unemployment, and lower income inequality, than communities with larger farms tied to often-distant agribusinesses.”

I didn't find a lot in the report by Food and Water Watch that would seriously substantiate a causation between increasing the number of small farms and higher income for a community.  What I did find there was a lot of correlational analysis and, in a few spots, some cherry picking of dates to make the argument more convincing.  

First, the article is correct that there is a long-term trend toward fewer, larger farms.  The cause isn't corporatization or greed or any of these factors, but rather increased technological progress that substitutes capital for labor and increases the returns to size.  The driving force on the other side of the supply chain are we consumers who relentlessly demand lower prices, higher quality, and more consistency.

When discussing the book Meat Racket, I previously listed a bunch of research on effects of vertical integration and concentration in animal agriculture (which is the focus of much of the above report). This review of the research by Michael Wohlgenant, for example, concludes:

Studies on market power in meatpacking indicate that concentration in procurement of livestock (cattle or hogs) has not adversely affected prices received by producers or prices paid by consumers.

Indeed, as I showed in this article in Animal Frontiers, the long run trend is much more output (due to technology gains) resulting in lower prices for consumers.  

So, what of the argument that communities with more small farms are financially better off than communities with more large farms?  That statistic may be true (or may not; I'm not sure what a representative look at the data would say).  But, even if so, I doesn't necessarily imply causation: that more small farms would increase the economic prosperity of a community.  Rather, I suspect the causation is the other way around.  

Most of the farms in this country are small farms, and you can be defined as a farm if you have just $1,000 is gross sales.  Most of these small farms/farmers aren't making a living from farming and they account for a very small share of the value of agricultural output.  The USDA classifies some of these as "residential" or "lifestyle" farms.  I suspect the more likely direction of causation is that people living in communities that happen to growing for some other reason  can afford to take on a "hobby farm."  That is, my guess is that economically growing communities spur growth in small farms, not the other way around.  

Moreover, if you look at work by my colleagues Brian Whitacre and Trey Malone, what you'll see in their graphs is that farmers markets and CSAs are largely an urban phenomenon.  They write: 

Generally, in counties where high percentages of Community Supported Agriculture or direct-to-human consumption exist, residents have higher incomes and population density is also high. In other words, the farms that enjoy high levels of support from their local populations are not typically located in more rural parts of the country.

This leads me to believe that  urban areas experiencing economic growth for reasons beyond agriculture are one of the key causes of more small farms.   So, again, it's not the small farms causing economic growth and vitality, it's the economic growth and vitality enabling small farming.