Blog

Local foods and seasonal price swings

In the Food Police, I wrote the following about local foods when critiquing the argument that a larger local food system would be better for the environment and for food security:

Because of common weather and temperature, all farms within a region are likely to have their produce come to market around the same time. In a world with regional and international trade, that isn’t a big deal as the surplus can be shipped out to other locations. But, in the locavore’s world, the result is inevitable: spoilage and waste.

...

It would be foolish to invest all your retirement savings in a single stock. The financial experts tell us to diversify. And if we shouldn’t keep all our financial eggs in one basket, the same goes for the real ones. One of the things that makes farming unique compared to other businesses is its unusually large reliance on the weather. An unexpected drought, a rain at the wrong time, an early freeze, or a hail storm can devastate a whole farming community or even an entire region. While farmers protect themselves financially against these kinds of risk by buying crop insurance, what about the food consumer?

This new paper in the Journal of Agriculture and Applied Economics by some Hawaiian researchers provides some empirical evidence of the price volatility I mention surrounding local foods.  Here's a graph from their paper showing production and prices of local tomatoes over 12 months of the year

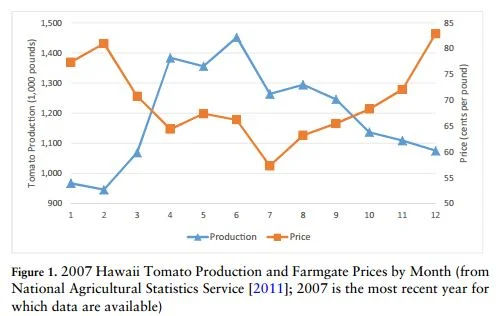
There is a very clear negative correlation between production and price.  When tomatoes are "in season" and local producers have a lot to sell, prices are low, and vice versa.

Of course, that inverse relationship is true for most of agricultural production.  But, here's the difference for a lot of local food production: A) with grains you can store the commodity to help smooth out prices over time (something much harder with perishable fruits and vegetables) and B) with trade you can ship to locations with different seasons (where there is less supply and therefore higher prices).

In short, by limiting sales to local consumers, producers are opening themselves up to a lot of potential price volatility, and to lower prices at the exact time they have produce ready to sell.  How can the producers partially mitigate such effects?  Find people in other locations with different seasons with whom to trade.  

The authors write:

It can be seen that local price premiums/discounts vary depending on product type and season. For grape and cherry tomatoes, there is an 18.18% local premium during season 1 (before the peak season). However, starting from season 2 (local peak season), price difference declines and becomes insignificant. On the other hand, there are constant local discounts for other tomatoes throughout the year, although prices are considerably lower in seasons 2 and 3. Comparing the results for both types of product, there is a clear downward effect on prices of local tomatoes during the peak production season, suggesting that market prices are likely influenced by the local production level.

One further contributing factor to the price discounting may be the capacity limitations in marketing and distribution by local producers in Hawaii. Since large national producers with more marketing and logistics competence have access to a larger market, production surpluses can be spread over more market areas with less need for discounting. In comparison, small local farms are often constrained by lack of distribution channels and market outlets (Martinez et al., 2010). In the case of Hawaii, because local tomatoes are exclusively supplied to the Hawaiian Islands, this may result in discounting at the retail level in times of production surplus.

Lastly, the Armington analysis shows that consumer choices with respect to locality and organic origins are elastic, and that both local and organic tomatoes are quite substitutable to import nonorganic tomatoes.


Meat Demand in an Era of High Prices

The journal Applied Economic Perspectives and Policy just accepted a paper I've written with Glynn Tonsor, which provides new estimates of consumer demand for different meat products using what is probably one of the largest and longest-running surveys choice experiments (a survey method) to date.  

The graph below showing changes in retail meat prices from January 2010 to January 2015 is  what motivated the paper. Beef and pork prices rose dramatically over this period (note: in the past few months they've come back down) whereas chicken prices were and still are fairly stable.   The following is further motivation from the paper:

Industry observers have expressed surprise about how consumers have responded to recent price changes (Ishmael, 2014). In particular, expenditures for beef and pork have not fallen as much as some people expected given the high prices. Industry analysts have asked “where is the tipping point” when consumers will stop buying beef and pork (Rutherford, 2014), but it may be that demand elasticities are more non-linear than previously realized. Moreover, relative price swings would have seemed to have favored chicken over beef and pork, and yet there does not seem to be a high degree of substitution in the current market environment. Such observations raise the possibility that cross-price elasticities have changed or are lower at higher price levels.

You can read the paper for the methods.  Here I'll just highlight what we found.

First, people with different incomes choose different things.  High income consumers are more likely to choose steak and chicken breast than are low income consumers, and the opposite is the case for chicken wings, ground beef, and deli ham.  

Second, beef prices are more sensitive to changes in the price of chicken than the reverse.  Here's an illustration of that phenomenon using our estimated model for middle income consumers.

Third, and somewhat surprisingly (though consistent with industry observations over this period), the quantity of beef and pork demanded is less sensitive to price changes when prices are high as compared to when prices are low.  In econ-jargon, demand is more inelastic as prices rise.  You can see that in the graphs above, and the paper fleshes out that finding a bit more by showing the bias in models that ignore this non-linearity in demand. 

Hopefully these new estimates will help us better predict in the near future what happens when beef and pork prices fall, and will help producers better anticipate the impacts of future price hikes.

This analysis used a huge data set (110,295 choices made by 12,255 consumers) collected over a year and half long period.  This is of course from my Food Demand Survey (FooDS).  The present analysis assumed people's preferences staid the same over this period.  Up next on the research agenda is to look at how these demand estimates have been changing (or not) over time using even more data over a longer time period., and investigating whether these survey-based demand changes can forecast changes in retail meat prices.   

Price impacts of avian influenza (bird flu)

Since the last time I posted on the issue, avian influenza has continued to spread, particularly in flocks of egg-laying hens, and the price impacts are becoming more apparent. 

Here's what I wrote back in April:

Demand for eggs is likely much more inelastic [than turkey] because of fewer substitutes. The elasticity of demand for eggs is probably somewhere around -0.15 to -0.20. The USDA-APHIS data indicates that about 4 million chickens (I believe these are egg-laying chickens) have been killed due to the flu. There are about 300 million laying hens in the U.S., implying this is a supply reduction of about 1.3%. Following the same logic as before, a 1.3% supply shock in the short run would cause a (0.013/0.15)*100=8.7% increase in egg prices in the immediate short run. Why so much higher than for turkey? Because demand for eggs is likely more inelastic than is demand for turkey. If the outbreak in egg laying hens doubles, reducing supply by 2.6%, that would imply a price increase of 17.3% in the short run.

Now, here's what Kelsey Gee wrote in the Wall Street Journal just yesterday:

Avian influenza has resulted in the deaths or extermination of at least 38.9 million birds, more than double the previous major U.S. outbreak in the 1980s. Of that total, more than 32 million are egg-laying hens, accounting for about 10% of the U.S. egg-laying flock.

The wholesale price of “breaker” eggs—the kind sold in liquid form to restaurants like McDonald’s Corp., food-service supplier Sysco Corp. and packaged-food producers—nearly tripled in the past month to a record $2.03 a dozen on Thursday, according to market-research firm Urner Barry. Meanwhile, U.S. prices for wholesale large shell eggs, those sold at the grocery store, have jumped about 85% to $2.20 a dozen in the Midwest.

The actual price impacts aren't that far off from what were predicted from my very simply supply/demand model.  In the very short run, supply is predetermined, so the price impacts of a reduction in supply are determined entirely by the shape of the demand curve.  A very simple demand curve is Q = e*P, where Q is the proportionate change in quantity, P is the proportionate change in price, and e is the own-price elasticity of demand.  Changes in price are thus given by: P=Q/e.  

Thus, if the change in quantity is about -10% as indicated in the WSJ article, and the elasticity of demand is about -0.15 as I previously suggested, the expected short-run price change is P = 0.1/0.15 = 0.667, or a 66.7% increase.  

The 85% price increase cited in the WSJ is larger than the projected 66.7% increase.  This could be because consumer demand for eggs has fallen among some consumers worried about bird flu (see my recent survey for evidence on that), so we may be witnessing not only movements along the demand curve but also a shift in the demand curve.  Or, it could simply be that demand for eggs was more inelastic that I previously assumed.  An own-price elasticity of egg demand of -0.117 rather than -0.15 would imply an 85% price increase in response to a 10% reduction in quantity supplied.  

But, no matter the cause of the price increases, it certainly isn't good for consumers who are harmed by having to pay higher prices for a smaller number of eggs. Producers who have lost flocks are certainly worse off.  The only beneficiaries are those egg producers who've (at least so far) avoided the outbreak.  

Are consumers really spending more on food away from home?

A couple days ago, the Wall Street Journal ran a story that started as follows

Retail-sales figures released by the U.S. Commerce Department garnered considerable attention last month when news reports suggested they showed Americans spent more money dining out than buying groceries for the first time ever.

Some observers jumped from there and attributed the shift to the growing clout of millennials, saying they prefer breaking bread with friends at restaurants, while sad-sack baby boomers who didn’t save enough for retirement are stuck cooking at home.

But as it turns out, reports on the decline of home cooking were half baked. They demonstrate, once again, that it is important to understand how the government compiles statistics to avoid jumping to conclusions the figures don’t support.

I agree.

As the story points out, the government's data ignores sales from some major grocery establishments like Wal-Mart.

This is an issue we've been tracking in the Food Demand Survey (FooDS) for over two years now.  Our data from a nationally representative sample of consumers show it's not even close.   People spend a lot more money on food at home.  Here's the data from our second annual report.

Our most recent release, just a couple days ago shows at home consumption at about $96/week and away from home at about $53/week.  

Thus, our data clearly supports the conclusion drawn by Jo Craven McGinty in the WSJ:

The government’s monthly retail-sales report provides valuable information that reveals legitimate trends, providing users understand what the numbers represent.

In this case, no matter how you slice it, spending on dining out hasn’t surpassed spending on groceries

How will avian influenza (bird flu) affect egg and turkey prices?

I was asked to make an appearance on Fox Business with Neil Cavuto this afternoon to talk about the impacts of the avian influenza (aka bird flu) outbreak on food prices.  I had a couple other commitments that prevented me from going on air, but I'll share a few thoughts on the matter here via the lens of ECON 101.

When a farm encounters a case of the bird flu, some birds die and others are euthanized.  This reduces the supply of birds.  In the graph below, this shifts the supply curve (the blue line) to the left.  In the immediate short run, this translates into a direct reduction in the amount of turkey or eggs on the market as the supply curve is perfectly inelastic.  

Consumers are now left to bargain over less quantity, and the shape of the demand curve (the red line) determines how high prices will rise.  The more inelastic the demand curve (the less price responsive are consumers), the greater the price increase.  In the longer run, the industry can adjust by adding new breeding stock, new houses, etc. (this makes the supply curve upward sloping rather than perfectly inelastic as shown in the right-hand graph), so the ultimate price effects will dampen over time.  


This simple economic framework can be put to use to calculate possible impacts.  According to data from USDA-APHIS, there have been around 3.3 million turkeys lost due to the flu.  There are about 240 million turkeys in the nation.  So, this represents a loss of about 1.4% of the turkey supply (this is the size of the supply shift in the quantity direction expressed in percentage terms).  Assuming the elasticity of demand for turkey is about -0.5, this would imply that we could expect a (0.014/0.5)*100=2.8% price increase in the immediate short run.  If the longer-run supply elasticity is, say, 0.8, the the longer-run price increase resulting from this supply reduction would be only (0.012/(0.5+0.8))*100=1.07%.  What if the outbreak grows in size and doubles?  Such that 6.6 million turkeys die?  This would be a 2.8% reduction in supply which would cause a (0.028/0.5)*100=5.6% short-run increase in turkey prices.

Demand for eggs is likely much more inelastic because of fewer substitutes.  The elasticity of demand for eggs is probably somewhere around -0.15 to -0.20.  The USDA-APHIS data indicates that about 4 million chickens (I believe these are egg-laying chickens) have been killed due to the flu.  There are about 300 million laying hens in the U.S., implying this is a supply reduction of about 1.3%.  Following the same logic as before, a 1.3% supply shock in the short run would cause a (0.013/0.15)*100=8.7% increase in egg prices in the immediate short run.  Why so much higher than for turkey?  Because demand for eggs is likely more inelastic than is demand for turkey.  If the outbreak in egg laying hens doubles, reducing supply by 2.6%, that would imply a price increase of 17.3% in the short run.  

There are a couple reasons to suspect these effects may be overstated.  First, exporters have slowed imports of chickens, turkey, and eggs because of the outbreak of the bird flu.  That means domestically - within the U.S. - we'll have more supply on the market because not as much is going out of the country.  Larger domestic supplies will mean downward pressure on  domestic prices that push against the effects of the initial supply shock (although it should be noted that either way, world prices will rise).  Second, the above analysis ignores substitutes.  Higher turkey and egg prices will cause people to substitute toward beef and pork, which will have feedback effects on turkey and egg prices.