A few weeks ago I participated in a panel discussion on CBC radio out of Canada on the topic of genetically modified animals. They aired the story this morning. You can list to the whole thing here.
Blog
The Cost of Animal Welfare Regulations
I was interviewed by Joshua Miller for a story in Boston Globe about an upcoming voter initiative in Massachusetts that would ban the sale of animal products that come from production systems that do not allow the animals to turn around or fully extend their limbs. As is usual in these stories, there is a lot of back and forth and speculation about the potential cost implications.
I'm happy to report that we don't have to speculate nearly as much. We now have some solid research on the topic related to the impacts of the animal welfare laws that went into place in California at the first of this year.
The first is a paper with Conner Mullally, where we use grocery store scanner data in California and non-California locations to study the change in egg prices caused by the new animal welfare laws in that state. We find the new laws increased egg prices in California by about $0.75/dozen. The abstract:
“New animal welfare policies on the horizon in many states have prompted debates
about the cost of achieving happier hens and hogs. A recent policy change in California
offers a unique opportunity to measure the economic repercussions of minimum space
requirements for egg-laying hens. Using retail scanner data from large California and nonCalifornia markets, we use difference-in-difference estimators to identify the effect of
minimum space requirements on retail egg prices, quantity sold, and sales value, while also
estimating impacts of the policy change on consumer welfare and egg producer net
revenue. We estimate that the law increased egg prices by about 22%, decreased quantity
sold by around 8%, and increased the value of sales by about 12%; the price and sales
effects are statistically significant at conventional levels. In the three California markets
included in our data set, consumer welfare losses amount to approximately $30 million
over the 16 weeks immediately following implementation of minimum space requirements
while net revenue from eggs sold in the three California markets increased by between 11%
and 15% over the same time horizon. Positive impacts on producers may have been short
lived, however, and were likely concentrated among producers located in California. Our
results are robust to several tests of our identifying assumptions. Overall, our findings
indicate that the potential economic costs of mandated improvements in farm animal
welfare should be taken seriously when considering such policy changes.
”
And a key graph:

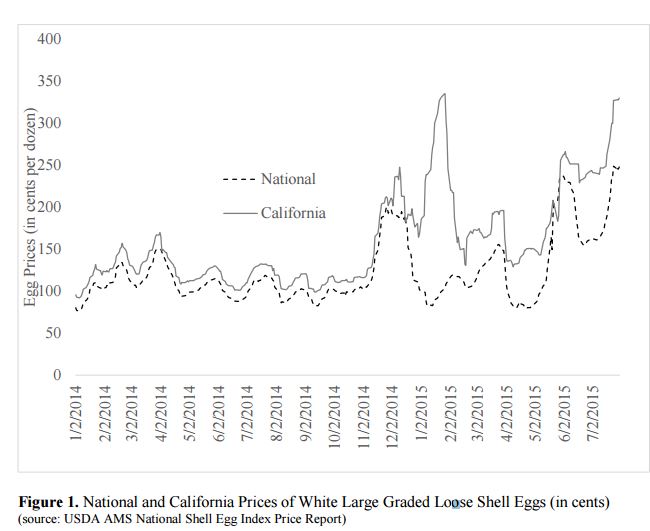
The second paper, with Trey Malone, looks at price changes in California relative to the US overall using price reports from the USDA Agricultural Marketing Service (this data set doesn't have quantity or sales data). The abstract:
“California voters passed Proposition 2 in 2008, which outlawed the use of battery cages. Subsequent legislation also outlawed the sale of eggs from battery cages in the state. While a number of ex ante studies have attempted to project the effects of the housing prohibitions, the ultimate ex post effects are unknown, in part because the law was only recently implemented. Using a new price series reported by the USDA Agricultural Marketing Service, we study the movement of daily egg prices in California and the rest of the United States from January 2014 until July 2015. Using two different methods, we calculate difference-indifference estimates to identify the effect of Proposition 2’s implementation on egg prices.
Depending on the method and model specification used, we find that Californians now pay $0.48 to $1.08 more for a dozen eggs. The estimates suggest that the laws result in a reduction in consumer surplus of between $400 million and $850 million annually. ”
A key figure from the paper. Unlike the data directly from the retail level used in the first paper, these USDA-AMS data show CA and non-CA prices rising before the January 1 implementation date, though the gap between the two widens afterward.
It's comforting when you have two different papers using two different data sets and different methods that yield similar results. And it appears that the removal of the so-called battery cages in California have led to a price increase of $0.50 to $1.00 per dozen eggs. Given that our first study shows little movement in quantities, the data suggest the price change is a result of increased cost (or reduced supply) not because consumer demand for eggs increased as a result of the change in hen living conditions.
Some Helpful Halloween Drinking Advice
Meat and Cancer
If you paid attention at all to the news yesterday, you surely saw the headlines proclaiming that bacon causes cancer. The news came out of the ruling of a committee (the International Agency for Research on Cancer, IARC) for the World Health Organization. (By the way, this is the same committee a couple months ago that made news when they announced glyphosate - aka Roundup - was carcinogenic).
What follows is a pointer to two of best analyses of the announcement I saw followed by my own thoughts.
Here's Ed Yong at the Atlantic.
“Here’s the thing: These classifications are based on strength of evidence not degree of risk.
Two risk factors could be slotted in the same category if one tripled the risk of cancer and the other increased it by a small fraction. They could also be classified similarly even if one causes many more types of cancers than the other, if it affects a greater swath of the population, and if it actually causes more cancers.
So these classifications are not meant to convey how dangerous something is, just how certain we are that something is dangerous.
But they’re presented with language that completely obfuscates that distinction.”
Then, in what is sure to become a classic line, Yong wrote:
“Perhaps we need a separate classification scheme for scientific organizations that are “confusogenic to humans.””
Over at Grist, Nathanael Johnson wrote the following
“What if you just want a sausage once every other week or so? The thing to keep in mind here is that IARC’s job is to figure out if substances can cause cancer, not if they’re likely to. It’s findings aren’t that useful to normal people looking for advice on how to live their lives.”
So, we need to keep in mind that the old adage that the dose makes the poison. And, we need to look at relative risks. Such as this one offered by Johnson:
“If today you start eating 50 grams a day (about three strips of bacon) more processed meat than usual, your risk of cancer increases 18 percent. For comparison, if you are a nonsmoker who starts smoking three cigarettes a day, your risk of lung cancer increases 600 percent.”
One thing rarely communicated in these sorts of reports is the baseline level of risk. Let's use Johnson's example and suppose that eating three pieces of bacon everyday causes cancer risk to increases 18%. From what baseline? To illustrate, let's say the baseline risk of dying from colon cancer (which processed meat is supposed to cause) is 2% so that 2 out of every 100 die from colon cancer over their lifetime (this reference suggests that's roughly the baseline lifetime risk for everyone including those who eat bacon). An 18% increase means your risk is now 2.36% for a 0.36 percentage point increase in risk. I suspect a lot of people that would accept a less-than-half-a-percentage point increase in risk for the pleasure of eating bacon.
Now, let's suppose instead that the baseline risk was 10% (10 out of 100 die from cancer). In this case, an 18% increase means your risk of cancer is now 11.8% for a 1.8 percentage point increase in chance of dying of colon cancer. Thus, the same percentage increase in risk (18%) results in very different changes in absolute likelihoods of dying (an increase of either 0.36 percentage points or 1.18 percentage points) depending on the baseline starting point. In a population of 1000 people who started eating 3 pieces of bacon, in one case we'd have about 3.6 extra people die and 11.8 extra people die in the other. That's more than three times as many people dying in the high-baseline risk case than in the low-baseline risk case. In short, studies that say that eating X causes a Y% increase in cancer are unhelpful unless I know something about my underlying, baseline probably of cancer is without eating X.
Is the growth in agricultural productivity slowing?
Last week I gave a talk at the University of Nebraska, and Julian Alston from UC Davis was also there. He presented some recent research with Matt Anderson and Phil Pardey about productivity growth in agriculture. While I have seen some discussions about the possibility of a slowdown in productivity growth in developing countries, Alston's research suggest it is a phenomenon alive and well here at home. This is important stuff. Falling productivity growth has important implications for sustainability, food security, and research and development. They write:
“We detect sizable and significant slowdowns in the rate of productivity growth. Across the 48 contiguous states for which we have very detailed data for 1949– 2007, U.S. multifactor productivity (MFP) growth averaged just 1.18 percent per year during 1990–2007 compared with 2.02 percent per year for the period 1949–1990. MFP in 44 of the 48 states has been growing at a statistically slower rate since 1990. Using a longer-run national series, since 1990 productivity growth has slowed compared with its longer-run growth rate, which averaged 1.52 percent per year for the entire period, 1910–2007. More subtly, the historically rapid rates of MFP growth during the 1960s, 1970s and 1980s can be seen as an aberration relative to the long-run trend. A cubic time-trend model fits the data very well, with an inflection around 1962. We speculate that a wave of technological progress through the middle of the twentieth century—reflecting the progressive adoption of various mechanical innovations, improved crop varieties, synthetic fertilizers and other chemicals, each in a decades long process—contributed to a sustained surge of faster-than-normal productivity growth throughout the third quarter of the century. A particular feature of this process was to move people off farms, a one-time transformation of agriculture that was largely completed by 1980.”
Here's a graph from their paper showing the change in proportional growth rate in yields (i.e., the log of yields) over time for 6 crops with the inflection point indicated for when growth rates began decelerating.
