Blog

Domestic Meat Shortages and Exports

The USA Today ran a story about meat shortages and exports in which I was quoted. There are several crisscrossing narratives running through the piece, so I thought it might be useful to clarify a few points.

On the one hand, the article discusses the volume of meat US packers exported to other countries, with the presumption being that it’s wrong to export meat abroad when we have shortages at home. But, then the article also argues:

But Americans were never at risk of a severe meat shortage, a USA TODAY investigation found, based on an analysis of U.S. Department of Agriculture data and interviews with meat industry analysts.

If that’s true, then the argument about exports seems irrelevant.

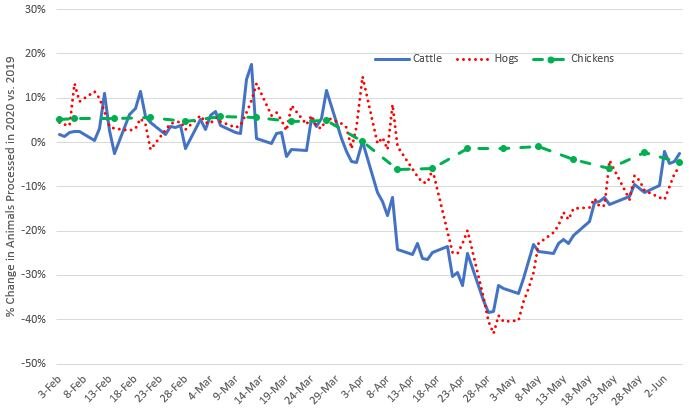
In any event, were we at risk of shortages? It is clear the packing sector took a significant, unprecedented hit and was producing far less beef and pork compared to last year. Here’s a figure I created based on USDA data on processing volumes.

slaughter_june.JPG

It’s also important to clarify what is meant by “shortage.” Why weren’t there more empty shelves in late April and early May given the reduction in processing volume shown above? The answer: prices. We are going to consume whatever meat gets produced, whether it is a small or large amount. If there is a larger than expected amount of meat being produced, prices need to fall to induce us to consume more than we otherwise would have. By contrast, if a smaller amount of meat is being produced than expected, prices need to rise to induce us to cut back and consume less than we otherwise would have.

Thus, prices are the mechanism by which scarce resources (like meat) get allocated. Retailers sometimes use other non-price mechanisms (like: limit of 2 packages per customer or long wait lines) to ration scarce supplies if they don’t want to pass on the full cost increases to consumers. Higher prices and other mechanisms like store buying limits are what helped prevent many grocery store shelves from being completely empty (i.e., having “shortages”).

So, did beef and pork prices rise to help allocate the significantly lower quantity being produced? Absolutely! Here’s a graph of changes in wholesale beef and pork prices based on USDA data.

prices_june.JPG

Finally, when discussing trade, I think it is really important to get the timing and trends right. If we want to explore how trade patterns responded to the plant shutdowns and reductions in domestic supplies, we need to look at data in late April and May. As the initial figure above shows, it was really only in mid April that we started seeing very significant reductions in processing volumes, with the “bottom” occurring in early May.

So, what happened to US meat exports? Here are some figures from the US Meat Export Federation (USMEF).

beef_exports.JPG
The USMEF defines an export as: “an actual shipment from the U.S. to a foreign country” whereas an “Export sale is defined as a transaction entered into between a reporting exporter and a foreign buyer. Sales can be cancelled or adjusted in followin…

The USMEF defines an export as: “an actual shipment from the U.S. to a foreign country” whereas an “Export sale is defined as a transaction entered into between a reporting exporter and a foreign buyer. Sales can be cancelled or adjusted in following weeks, thus “net” sales are reported as the difference between new sales and any cancellations or adjustments.”

These figures show a sharp drop in sales of beef and pork at the time we starting seeing the worst of the packing plant shutdowns and closures. Actual exports (i.e., movement of meat across the border) also fell, albeit at a slower rate than sales, revealing the lagged nature between when a “sale” is made and when the meat leaves the country. It’s one of the reasons the data showed exports persisting for a few weeks even after plants began to close: the meat had already been sold weeks prior to the plant shutdowns occurring.

Why would exports fall in response to the COVID-related packing plant shutdowns? Perhaps it was patriotic duty on the part of packers to feed American consumers. I suspect the over-riding motivation was economics. As the price data illustrated above clearly shows, packers could fetch a higher price for their meat here at home. That is, packers didn’t have to be coerced into reducing exports as there was a strong economic incentive to sell into domestic markets. Again, we see prices serving as a key mechanism to re-direct meat supplies to help prevent “shortages.”
California Animal Welfare Laws Impacts Egg Prices Nationwide

The American Journal of Agricultural Economics just released an interesting new paper entitled “Piecemeal Farm Regulation and the U.S. Commerce Clause” by Colin Carter, Aleks Schaefer, and Daniel Scheitrum. The paper builds off some previous work I’d published with Conner Mullally and Trey Malone about the impacts of California’s animal welfare laws, which require more space for hens, on egg prices. The new paper by Carter, Schaefer, and Scheitrum goes further in answering some important questions. Namely, what impacts have California laws had on consumers and producers in other states?

They write:

The balance between a state’s power to regulate food production within its borders and the impacts of such governance initiatives on consumers and producers in other states is the subject of intense policy debate. The food movement in America has generated piecemeal state laws that—in effect (and possibly by design)—influence how farms in other states operate.

Here’s a summary of their findings.

Our results indicate that the policy had widespread effects across the U.S. In the months following implementation of AB 1437, wholesale egg prices in the Midwest, Northeast, Southeast, and South Central U.S. experienced a dramatic increase. Since then, prices have continued to trade at a 7¢–10¢ premium over their former long‐term equilibrium. AB 1437 has also increased the share of laying hens housed in California‐compliant enclosures across the U.S and led to increased concentration of out‐of‐state firms shipping eggs to California. Between January 2015–December 2017, California hen housing requirements cost U.S. consumers almost $2.7 billion. The majority of these costs ($1.98 billion) were borne out of state.

They also found that California’s laws:

shut many small producers out of the California market and led to more concentrated interstate trade.

Of course, some people really value improvements in animal welfare, and there may be “external benefits” that aren’t captured in market prices and transactions. Another externalities, that this paper reveals is that that Californians are imposing higher egg costs on consumers in other states who didn’t vote in their animal welfare referendum. The authors calculate:

if we evaluate the policy from a U.S.‐wide perspective, the annual per‐capita external value would need to range between $35.61 and $108.57 per capita to be cost effective

On a couple different occasions attorney generals from other states have tried to sue California over these laws based on arguments that they violated the U.S. Interstate Commerce Clause. The suits have failed, as I understand it, not necessarily on the merits of the case per se but because the courts have decided the attorney generals don’t have “standing” to bring the case because they aren’t egg producers. These issues are unlikely to go away. California recently passed new animal welfare standards that go beyond the space requirements for hens and will ultimately require all hens be cage free. California isn’t alone in passing cage free standards, and other states such as Massachusetts and Washington have similar measures being implemented. Moreover, these issues are unlikely to only relate to eggs. GMO labeling standards were going down the same route until a federal policy was ultimately passed. Might we see similar state-by-state regulations on pesticides, labor standards, or preservatives?

Update on Meat and Livestock Markets in the Wake of COVID

Fortunately, it appears the worst of the COVID-related disruptions to meat and livestock markets may be over.

The figure below shows the most recent data on livestock and chicken slaughter (cattle and hogs are daily on weekdays; chickens is weekly). The worst of the disruptions occurred in late April and early May when we were running about 40% below last year, but significant improvements have been made since then. For beef and pork, the plants are mainly back online, but are running at reduced capacity due to social distancing of workers, etc. Beef and pork are currently running at about 10% to 15% below last year. Chicken processing hasn’t deviated more than plus or minus 10% from last year at any point during this period.

ffig1.jpg

The changes in processing capacity have translated into changes in wholesale prices. Below are wholesale beef, pork, and chicken prices.

fig2.jpg
fig3.jpg
fig4.jpg

The quantity and price data above can be used to calculate demand indices, which are shown below.

fig5.jpg

Here are beef and pork marketing margins (the difference between wholesale meat price and the farm-level livestock price), which I previously discussed here. One of the reasons the pork margin is lower is that it is based on a carcass-weight hog price whereas the beef margin is based on cattle live weight prices.

fig6.jpg

Finally, as I previously indicated, all meat isn’t created equal during a pandemic.

fig7.jpg
fig8.jpg

Purdue Food and Agriculture Vulnerability Index

Since the onset of the pandemic, I’ve been working with Ranveer Chandra, Chief Scientist for Microsoft Azure Global, and his team to help conceptualize and convey whether and to what extent COVID19 related illnesses pose a risk to agricultural and food production. Today, we finally have a beta version of our dashboard ready for viewing.

The basic idea is to compare the geographic pattern of COVID cases to the geographic distribution of agricultural workers and agricultural production for particular crops and animals. If there are a large number of COVID cases in a location that grows the vast majority of a particular agricultural crop, then we can infer that production of that crop is at risk. The level of risk is inferred by creating an estimate of the percent of total state or national production of a crop that is potentially lost from COVID illnesses.

As it turns out, for the handful of agricultural commodities we’ve entered in our tool thusfar, the risk is very low (far less than 1% of total production estimated to be at risk). The reasons are straightforward: 1) production of most major agricultural commodities is distributed over a wide geography, and 2) the percent of the population with COVID in rural/agricultural areas remains low.

One of the main purposes of the tool is to help people visualize a portion of our food supply chain, to help people better understand where their food comes from, and to help illustrate that, at least at the moment, COVID pose little risk to the aggregate supply of food in the United States.

There are several ways I hope to expand this tool, should funding emerge and time allow. As we’ve seen, the risks from COVID appear to be less related to agricultural production and more related to food processing. Data on location and distribution of food processing facilities, and numbers of food processing workers employed in each location, is harder to come by but it’s not an impossible task. There are other items we’ll continue to work on to help make the tool more user friendly and functional.

A screenshot of the dashboard is below, but you’ll need to go to the Purdue page to actually use the tool.

covid_tool.JPG

Thanks to Ranveer Chandra, Hope Foley, Riyaz Pishori, Anirudh Badam, Jerry Neal, Stacey Wood, Peeyush Kumar, and Deepak Vasisht from Microsoft and Aaron Walz and Kami Goodwin at Purdue for their help getting this dashboard up and running.

Exploring Polarization in US Food Policy Opinions

That’s the title of a new paper co-authored with Christina Biedny and Trey Malone that is forthcoming in the journal, Applied Economic Perspectives and Policy. We build off some previous work I’d published trying to measure political ideologies with respect to food to see how attitudes and perspectives have changed over time. Here’s the abstract:

Many maintain that the US political climate has become more charged with partisan beliefs over the past decade, although little is known about whether this partisan divide can be observed in food policy opinions. This article aims to determine whether Democrat and Republican food policy opinions diverged between 2011 and 2018. We find evidence of the contrary; partisan public opinions on food and agriculture policies have actually converged, with both major parties exhibiting a preference toward heightened government intervention. Our results indicate that voters preferring more government intervention in food policies have become more numerous in the Republican Party for issues including animal welfare and affordable food. However, once we include Independents and other third parties in our sample, we find that the variance between food policy opinions has increased for many policies.