Blog

Consumer Food Insights - June 2022

The June edition of the Consumer Food Insights (CFI) survey is now out. This month’s report is chock-full of interesting data and insights.

Here are a few highlights:

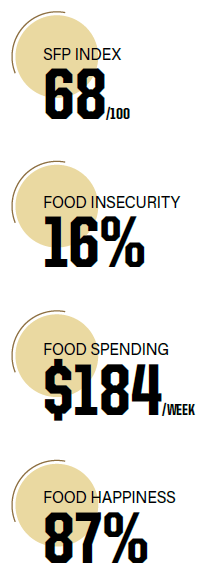
  • The Sustainable Food Purchase Index reached it’s highest level (70 out of 100) since our tracking survey began in January 2022.

  • Food spending continues to climb; this month the main increase is from spending on food away from home while spending on grocery was essentially flat.

  • Measured rates of food insecurity remain steady but there are some signs of belt-tightening among consumers, as there is an increase in price sensitivity and choice of generics over brands as well as an increase in food spending as a share of income for the lowest income consumers.

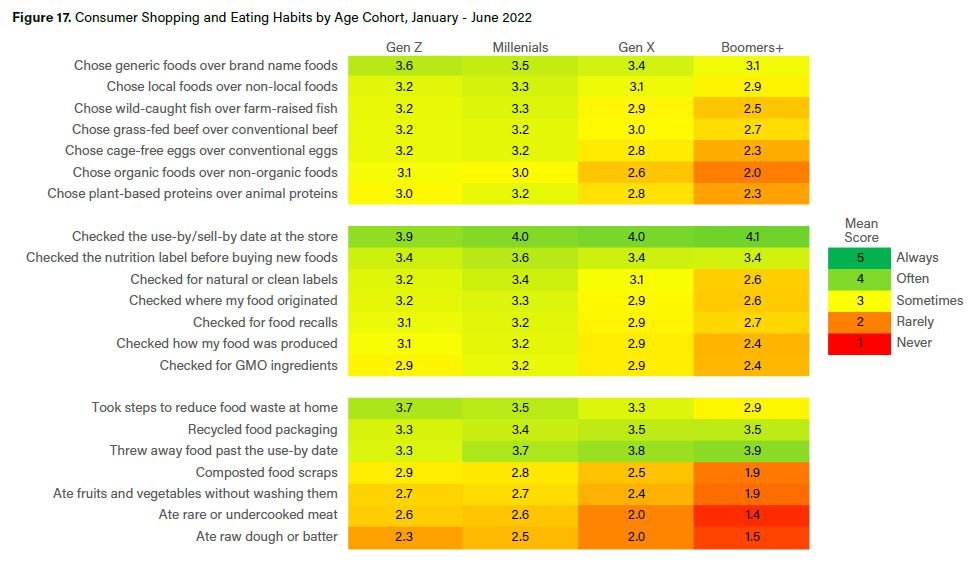
This month, we did a deep dive into impacts of age on consumer food behaviors and attitudes. There were significant age/generation gaps in several of our measures. For example, younger generations tended to place more important on environment and social issues when buying food compared to older generations.

It is also the case that food insecurity is highest among the younger households.

A corollary is that older consumers are more happy and satisfied with their food and diets than younger consumers. There are also differences in beliefs and purchase behaviors as the figure below illustrates.

Finally, we added a number of new ad hoc questions this month related to gardening, global food supply chain disruptions, and overall satisfaction with food issues relative to other issues in daily life. Seventy percent of respondents said they were worried or very worried about the Russia-Ukraine war affecting global food supplies; a smaller share, but still a majority (58%) thought the war had directly affected their food prices or availability. The most favored policy response was to increase U.S. food production.

There is a lot more in the full report. I encourage you to check it out at our Center for Food Demand Analysis (CFDAS) website.

Quantifying One Aspect of Food System Vulnerabilities

The American Journal of Agricultural Economics just released my co-authored paper with Ahmad Wahdat on food system vulnerabilities (this an updated and revised version of the working paper I blogged about in November). The paper uses input-output tables to calculate how, for a given food processing sector in a given state, how diversified input purchases are across input categories.

Here is one paragraph from the conclusions:

In this article, we identify the U.S. food industries’ vulnerability to upstream industries and labor occupations. We do this by calculating the exposure of food industries to upstream industries and labor occupations in terms of input purchases. Upstream industries are relevant for the purchase of intermediate inputs, and labor occupations are relevant for specialized labor. To complement our analysis of food industries’ vulnerabilities, we calculate the Simpson’s Diversity Index (SDI) and also estimate the gross output elasticity of inputs. We use data on input purchases, gross output, and labor earnings from Economic Modeling Specialists International (EMSI) and the U.S. Census Bureau from 2019. In terms of our main findings, we show that the animal slaughtering and processing industry has the lowest SDI score (0.66), which means the industry makes most of its purchases from a few upstream industries. Out of all upstream industries, food industries’ intermediate input purchases are exposed to a total of 22 upstream industries that can be classified under four groups: (a) agriculture, fishing, and hunting (RawAg); (b) food and beverage (FoodBev); (c) transportation and packaging (Transp); and (d) miscellaneous (Misc). Food industries rely heavily on (a) production labor and (b) transportation and material moving labor. Food industries’ gross output is the most elastic with regard to intermediate inputs from FoodBev industries (0.23) and RawAg industries (0.22). Among labor occupations, gross output elasticity is the highest with regard to production labor (0.1).

You can read the whole thing here.

Consumer Food Spending Over Time by Income

In the past, I’ve showed data on on the relationship between income and food spending. With help from my colleagues in the Purdue Center for Food Demand Analysis and Sustainability (CFDAS), we’ve created a new data dashboard showing how consumer food spending varies over time and by income.

We make use of Bureau of Labor Statistics data on from their annual consumer expenditure survey, and one of their main reports that indicates spending on different categories of food by income quintile.

The dashboard can be used to show inflation-adjusted spending by income over time, and food spending as a share of total income (these are so-called Engel curves). Here’s a screenshot of the dashboard showing spending on food at home in the years 1984, 1990, 2000, 2010, and 2020. At all income levels, one can see that inflation-adjusted spending on food has fallen over time.

It is also possible to see trends for individual food items and different income quintiles. For example, here is spending on fresh fruits and vegetables by the highest income consumers since 1984 both in total and as a share of income.

And, now, the same data but for the lowest income consumers.

Want to see a different food group? Or different income level? Play around with the dashboard yourself.: enjoy!

Consumer Food Insights - May 2022

The May 2022 edition of the Consumer Food Insights (CFI) survey from the Center for Food Demand Analysis and Sustainability (CFDAS) at Purdue is now out. Most of our main tracking numbers, including the Sustainability Food Purchase (SFP) index, food insecurity, and food happiness remained steady. However, after a small dip last month, total food spending increased this month about 7% from the prior month. The survey also shows consumers reporting higher rates of food price increases in prior weeks and months than they had in earlier releases.

We added a couple new ad hoc questions this month. Following up on my last post about gardening, we added a question to measure the extent to which households grow food at home. A little over 20% of respondents said they are growing food at home in a garden (whether people consider herbs on the windowsill a “garden” is something we’ll have to probe in the future). About 5% said they grow food in a community garden. Almost three-quarters of consumers are not gardening, with the majority of those never intending to do so.

Given the dramatic rise in fertilizer prices facing farmers, and some of the media speculation about how how farmers should be responding, we thought we’d probe our consumers on some of these issues by asking the extent to which respondents agreed with a series of questions. The highest level of agreement was with the statement that “farmers know best how much fertilizer to use on their field.” Despite popular agreement that “farmers know best” there was also a lot of agreement that farmers should be fertilizing differently than they are now. There was a widespread view that a move to organic, compost, and manure fertilizer are preferable, although it should be noted that the questions did not mention the consequences for food prices or food availability. Almost half of consumers neither agreed nor disagreed that “synthetic fertilizers are necessary to keep food prices low.” Such results suggest a lack of understanding about the impacts of use of fertilizer in agriculture (the recent example of Sri Lanka’s price spikes following a ban on synthetic fertilizer is a particularly pertinent example).

In this month’s CFI report, we did a deeper dive into how responses varied by race. One salient result relates to food insecurity. Black and Hispanic individual were much more likely to be food insecure as compared to white and Asian individuals.

Food Security and Insecurity by Race

There is a lot more in the report.

Finally, as I noted in last month’s release, we’ve created a data dashboard to explore some of the responses to questions in current and past editions of the Consumer Food Insights survey. The dashboard focuses allows the user to see how responses vary by demographic characteristics of respondents.

Interest in Gardening

I was chatting with a few colleagues this morning and the topic of gardening came up. Curious as to whether there was more interest in gardening this year as food prices are rising, a search on google trends commenced.

Google searches for "gardening"

Google searches for "gardening"

As the graph above reveals, google searches for “gardening” are highly seasonal, peaking in April and May each year. Also interesting is the apparent downward trend in searches for gardening since 2004. The downward trend was disrupted by COVID-19. In 2020, searches for gardening peaked in April and May at levels that hadn’t been seen in at least a decade. In 2022, we appear to be leveling off below the last two years.

While the COVID peak is apparent in the above graph, it wasn’t as large as perhaps might have been expected. In Google Trends, one can also search in categories. If I search “gardening” in the “shopping” category, here’s what I find.

Google searchers for "gardening" in the shopping category

Google searchers for "gardening" in the shopping category

If I understand these data correctly, this is an index of the volume of searches for gardening with the intent to buy gardening-related items. In this rendition, May 2020 is the peak over this 18 year time period. The dotted-line forecast suggests this May may be another banner year for sales of gardening-related wares.

Does gardening respond to economic factors like food prices and recession-induced changes in income or time availability? Is gardening an inferior, normal, or luxury good? Does interest in gardening vary with health concerns? These questions are ripe for academic research.