This post by Kevin Patrick at farmdocdaily alerted me to an interesting data visualization tool created by the USDA Economic Research Service (see the bottom of this web page for a three different tools).
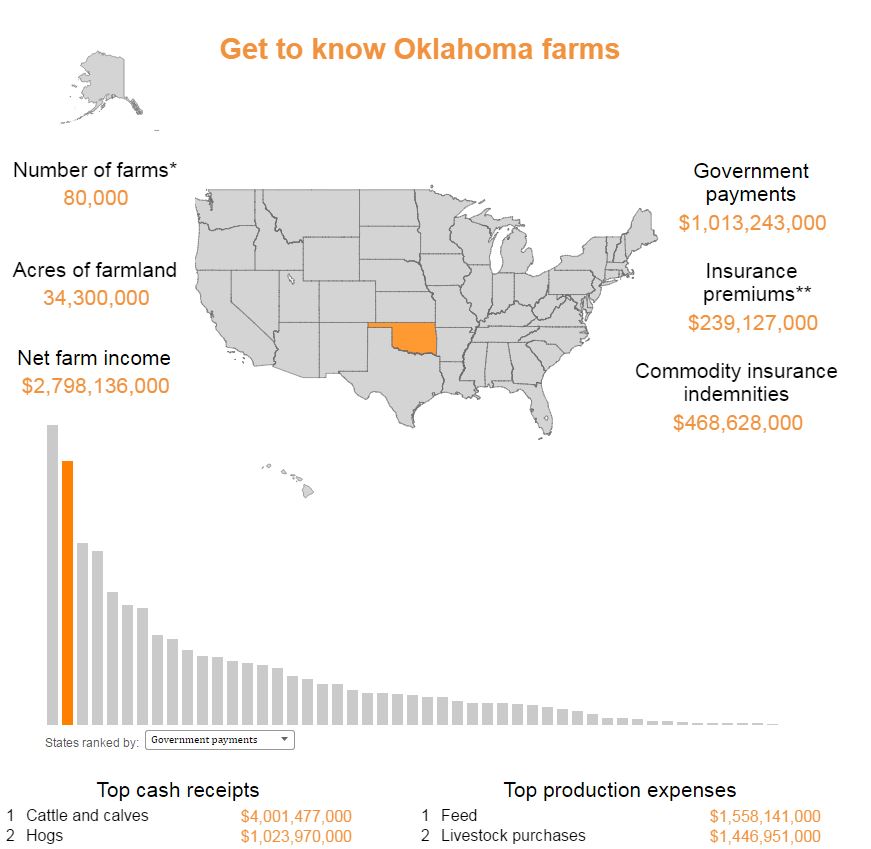
I used the "get to know your state" tool and pulled up Oklahoma. I was a bit surprised to see that in 2014, total government payments to the state were over $1 billion while at the same time net farm income was $2.8 billion. If I'm reading this right, it implies 36% of net farm income in OK in 2014 was government payments, and Oklahoma ranked 2nd in government payments while ranking only 23rd in sales. Thinking this might be an aberration, I pulled up 2013, and then "only" 19% of net farm income in Oklahoma was government payments.
Looking at the supposed "big government", California (which has the most ag sales of any state), only 1.5% of its net farm income was from government payments in 2014.
The "farm income atlas" tool lets you plot government payments (and other components of income) for each state. Here's total government payments for 2014.

There's a lot more available in the tools. Check it out yourself.