The Mercatus center just released a paper I wrote entitled "The Evolving Role of the USDA in
the Food and Agricultural Economy." I decided to write the paper after having a number of conversations with folks who held a variety of beliefs (some correct, some incorrect) about how agriculture has changed and were curious about the role of the USDA and how it has evolved over time. In the next few posts, I'll share some of the data and figures I pulled together for the paper (most of which comes perhaps ironically from the USDA).
Here is a bit on the evolution of American agriculture. Future posts will cover changes in the USDA.

In 1900, just under 40 percent of the total US population lived on farms, and 60 percent lived in rural areas. Today, the respective figures are only about 1 percent and 20 percent.
The United States had between six and seven million farms from 1910 to 1940 (figure 1). A sharp decline in the number of farms occurred from the 1940s to the 1980s. At the same time, the average farm size more than doubled, from about 150 acres to around 450 acres.

Whereas farm households earned lower incomes than other households before the 1970s, since the mid- 1990s, farm households have consistently earned more than other US households. In addition to earning higher incomes, farm households today tend to have substantially higher net worth than the average US household. Census data indicate that the mean (median) net worth of all US households in 2012 was $338,950 ($68,800). By contrast, the mean (median) net worth of farm households in 2014 was $915,210 ($802,000). In 2012 (the last ag census date), 98 percent of farm households had a net worth that exceeded the net worth of the median US household. (The average income for farm households in 2015-2016 is likely to come down somewhat given the fall in commodity prices.)

Farm household incomes have become more diversified over time in the sense that the percentage of household income from farming has steadily declined (aside from the increase in 2011–2012 from higher commodity prices). So while farms have become more specialized (growing fewer commodities than they did in the past), the household income of farmers has become more diversified and less reliant on farm income

Small farms account for only a small share of the value of agricultural output. In fact, farms with total sales of less than $25,000 (more than half of all farms) account for less than 1 percent of the value of agricultural output while farming 20.7 percent of the acreage. By contrast, 7.5 percent of the larger farms (those with more than $500,000 in sales) account for 80 percent of the value of agricultural output while farming only 38.4 percent of the land. These data suggest that much of the information the USDA reports on farms fails to correspond with businesses that have any substantive level of output.

The changes in the number and composition of farms over time are partly attributable to changes in technology and market conditions. The figure above shows an index of yields for corn, wheat, and cotton. Corn yields in 1900 were only 18 percent of what they were in 2014. In 1900, wheat yields were only about 30 percent of what they were in 2014. With the adoption of tractors, synthetic fertilizers, and improved seeds, yields began climbing after World War II. Yield growth has continued until today, although the rate of growth has slowed somewhat in recent decades.

It is possible to achieve higher output by increasing the volume of the inputs used. However, total agricultural output has more than doubled since 1948, while key agricultural inputs have fallen. More output with fewer inputs implies increased productivity. According to USDA-ERS data, in 1948, the amount of labor used in agriculture was four times what it is today. As the above figure shows, the United States produces more agricultural output today, despite using less land and substantially less labor.
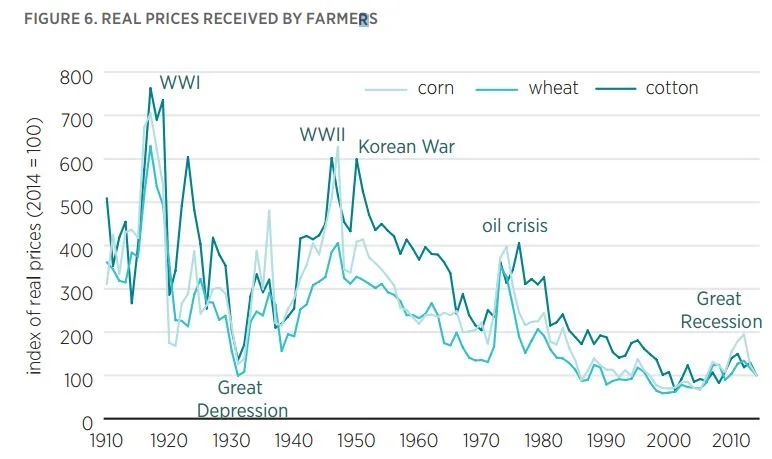
Increasing productivity leads to falling prices. The figure above shows an index of real prices from 1910 to 2014 for corn, wheat, and cotton. Before the 1950s, prices for those commodities were routinely three to six times higher than they are today. The beneficiaries of falling agricultural prices have been food and fiber consumers. Farmers face lower prices today than in the past, but as the preceding figures reveal, they have more output to sell, resulting in higher net incomes.
In short, today there are fewer but larger farms than there were in the past. The farms that remain tend to earn higher incomes and have higher net worth than average US households. Farm production is today heavily concentrated among a small share of about 160,000 producers.