In my last post, I mentioned the creation of the Center for Food Demand Analysis and Sustainability (CFDAS). As a part of the launch, we are releasing two dashboards to help describe the food processing sector in the United States and to illustrate how the sector has been affected by COVID-19. Thanks to Ahmad Wahdat for his excellent work in creating the dashboards.
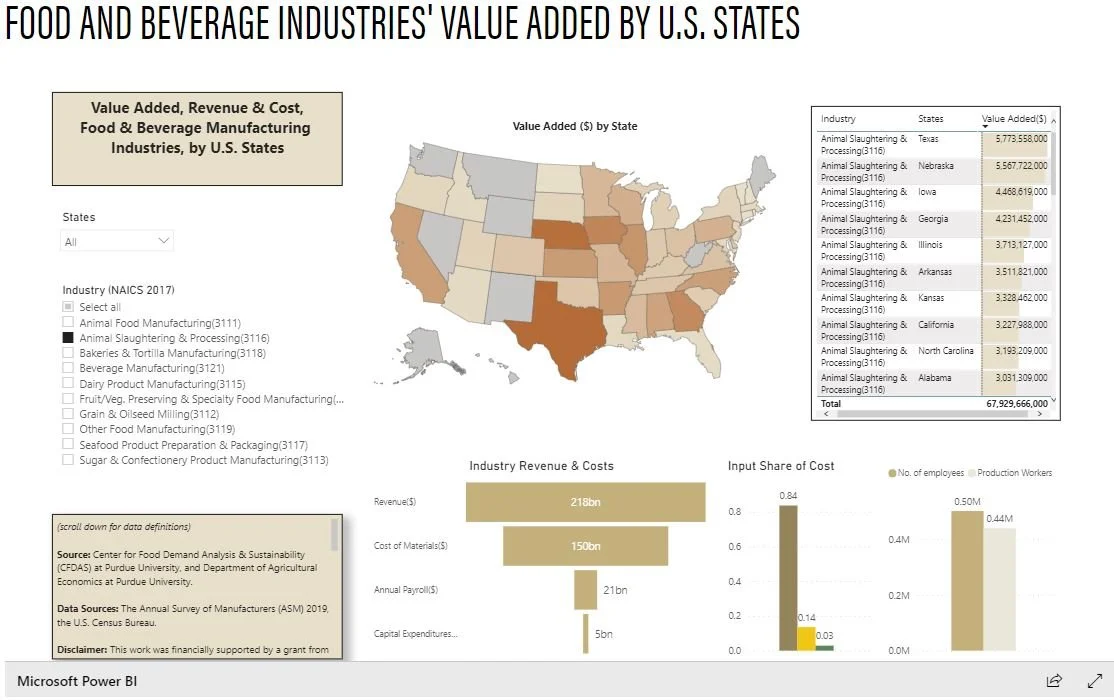
The first dashboard (available here) describes the Food and Beverage Industries’ Value Added by U.S. States.
The U.S. food and beverage industries are the connecting link between the agriculture sector and the grocery retail sector. In a nutshell, the U.S. food and beverage industries buy raw inputs from farmers and sell final or intermediate products to both consumers and producers. This dashboard provides information on each industry’s production value, revenue, costs and employment. All such information is presented at the U.S. state level. Select one (or multiple) states or industries for customized information, and click on a state (within the map) to see geographic variation
The second dashboard is modeled off the Purdue Food and Agricultural Vulnerability Index, which we released over a year ago to provide estimates of farm worker illnesses from COVID19. The new dashboard, we’ve title Food and Beverage Industries’ COVID-19 Vulnerability Index by U.S. States and Counties, extends this analysis to the food processing sector.
This dashboard presents the estimated value of vulnerable production in food and beverage industries due to estimated COVID-19 cases among industry workers. Users can find information on estimated vulnerable production in the past 365 days and past 30 days; COVID-19 industry worker cases in the past 365 days and past 30 days; total industry jobs, and total payrolled industry establishments. This dashboard can display information both at the state and county level.
Users can select one (or multiple) industries for customized information. The U.S. map is presented with state-level view. However, users can click on the double down-arrow button to get a county-level view. We calculate the expected industry workers with COVID19 using real-time information on COVID19 cases.
