Blog

Personal Choices to Reduce Greenhouse Gas Emissions

This article in Environmental Research Letters by Seth Wynes and Kimberly Nicholas calculates the ways various personal choices affect greenhouse gasses. The paper has received a lot of attention in the media (e.g., see here or here).   At the heart of the issue are the results from this figure in the original paper showing the relative effect of different actions on greenhouse gas emissions.


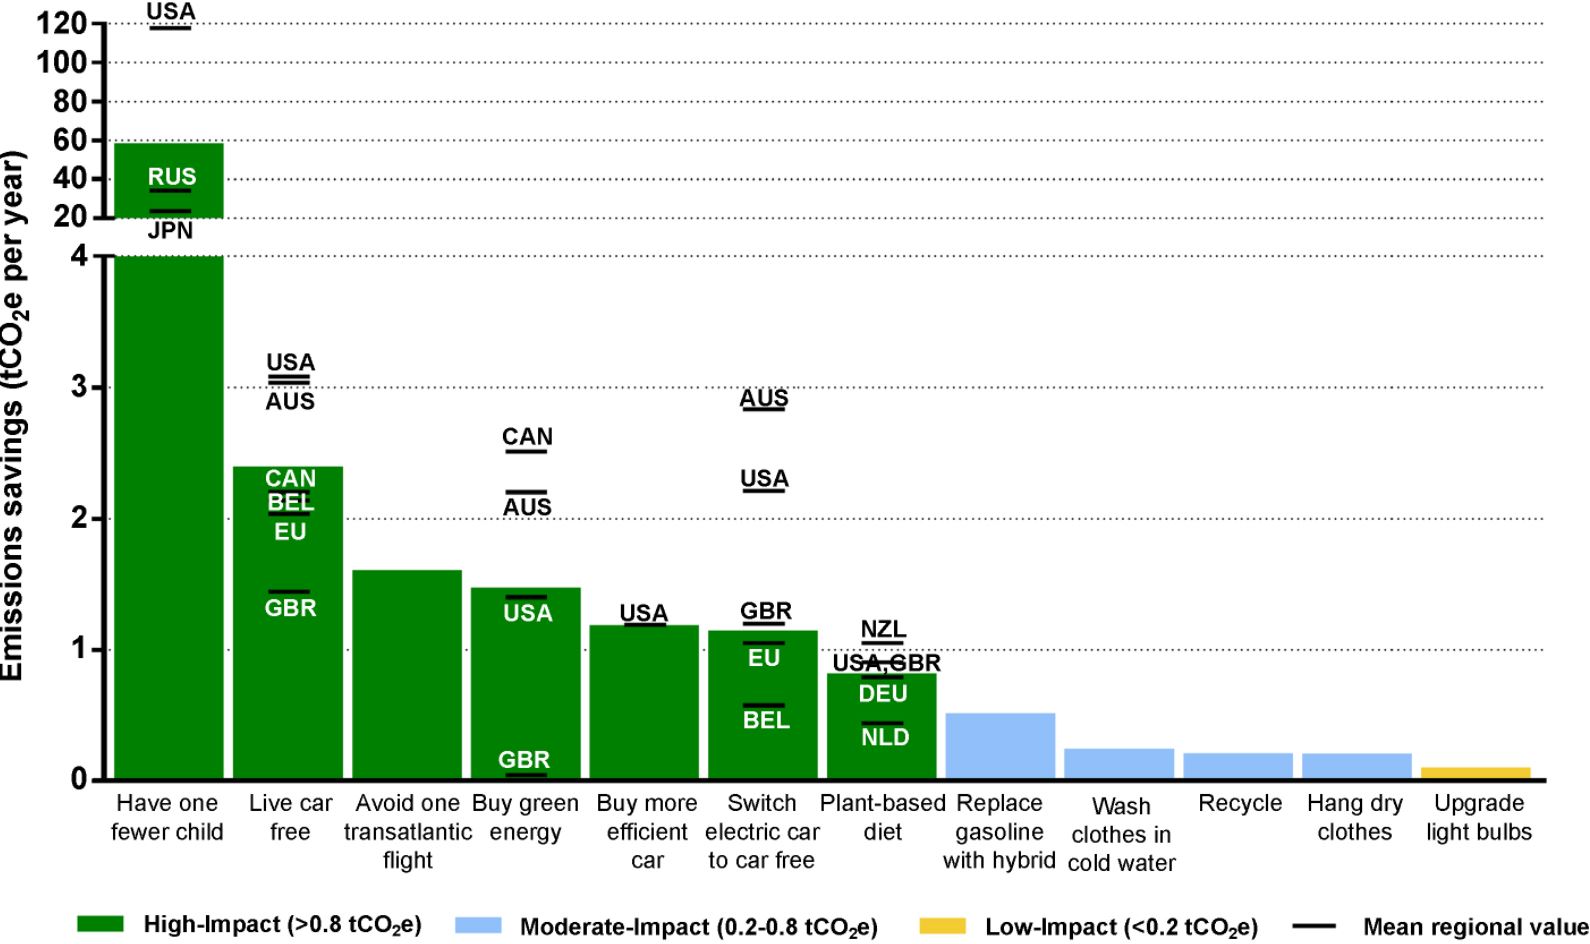
The findings led to headlines like this one in The Guardian, "Want to fight climate change? Have fewer children."  The findings are interesting on a number of fronts.  For example, I regularly see stories suggesting that the most impactful thing one can do to fight climate change is eat less meat.  That strategy shows up as a mere 7th on this chart, and way, way behind having children (not having a child has more than 60 times the emissions impact as moving to a more plant based diet).  

The implication that we should have fewer children raises a number of thorny issues that have long been debated.  Since at least Malthus, folks have been worried about a growing world population.  Stanford biologist Paul Ehrlich has raised alarm since the 1960s about the dire consequences of a "population bomb."  At the heart of this thinking is the premise that an extra person is a kind of threat: a threat to food security, a threat to the climate, a threat to the environment.  There's even a bit of a hint of this thinking in the common mantra of many agricultural organizations that we need to do what we can so that we can feed nine billion people by 2050.  The extra people that will arrive in the next 30 years or so are placing a burden on us today to increasing productivity.  

An alternative perspective, one often attributed to Julian Simon, is that an extra person is a blessing rather than a curse.  People aren't just consumers of resources but are are sources of ideas, creativity, and ultimately new resources.  An extra person isn't a threat but an opportunity.

Regardless of where one falls in this debate, it should be noted the above graph looks at just one side of the equation: the cost of an extra human in terms of extra greenhouse gasses.  What is ignored is the potential benefit of an extra human.  What is the opportunity cost of a foregone Einstein, Edison, or Jobs?  Going further, who are the folks most likely to heed the advice to forego children for the climate, and what would their would-be kids have been like?

It is also worthwhile mentioning that there is no guarantee that population will continue to grow, particularly if the world continues to develop and incomes rise.  Even the UN projections place some probability on a population decline in 30 years time.  One writer of Wired magazine, Kevin Kelly, when asked what we should be worried about (but presumable are not), fretted about about an underpopulation bomb.  Here's what he writes:

Here is the challenge: This is a world where every year there is a smaller audience than the year before, a smaller market for your goods or services, fewer workers to choose from, and a ballooning elder population that must be cared for. We’ve never seen this in modern times; our progress has always paralleled rising populations, bigger audiences, larger markets and bigger pools of workers. It’s hard to see how a declining yet aging population functions as an engine for increasing the standard of living every year. To do so would require a completely different economic system, one that we are not prepared for at all right now. The challenges of a peak human population are real, but we know what we have to do; the challenges of a dwindling human population tending toward zero in a developed world are scarier because we’ve never been there before. It’s something to worry about.

 A couple final thoughts.  The above graphs shows several possible mitigation options, but I haven't heard much discussion of tradeoffs.  Surely the end goal in life isn't to focus all our individual energies on activities to reduce carbon emissions.  So, given my preferences for driving, eating meat, or being a parent, the figures above suggest useful ways of thinking about this problem.  Maybe I don't want to have a more plant-based diet, but at least in terms of greenhouse gas impacts, I can "offset" that and more by foregoing my trip to Paris this year.  

More broadly, we don't normally worry about impacts of our various consumption choices on availability of other resources like steel or fertilizer or labor.  Why?  Because the market price for the goods should reflect the relative scarcity of these items.  One upside to a carbon tax is that we could forego all the moralizing and all these sorts of "consumption advice" types of papers and simply allow consumers to make choices they want given the relative prices of different goods.  But what about children?  The above graph would seem to justify a large carbon tax on having kids.  I'd guess that is a highly unpopular idea, which suggests to me that most of us are more likely to be in the Simon camp than the Ehrlich one when thinking about our own offspring.  

Food Waste Research

Back in 2013, I wrote this post decrying the lack of good research on the economics of food waste.  It wasn't that no research was being done on the issue, only that a lot of the research that had been published at that time is what I'd call food waste accounting, which didn't didn't rely much on the economic way of thinking.

I'm pleased to now see a nice stream of economic research on the subject.  I've blogged on several of these papers before, but now many are starting to appear in print at peer reviewed journals.  Here'a a hopefully handy list of references.

  • "On the Measurement of Food Waste" by Marc Bellemare,  Metin Çakir,  Hikaru Peterson, Lindsey Novak, and Jeta Rudi, forthcoming the American  Journal of Agricultural Economics (This is an important - and likely to be influential - paper that is critical of previous attempts to measure the economic costs of waste and suggests better ways forward).
  • "A Note on Modelling Household Food Waste Behavior"  by Brenna Ellison and me, published in Applied Economics Letters in 2017 (This is a short note showing what is probably obvious to every economist but perhaps not to others: that the optimal amount of waste isn't zero and it depends on various economic variables like food prices and income).
  • "Food waste: The role of date labels, package size, and product category" by Norbert Wilson, Brad Rickard, Rachel Saputob,  and Shuay-Tsyr Hob, published in Food Quality and Preference in 2017 (The authors crafted a clever experimental approach to measure waste in a lab setting and looked at how how measured wasted varied with across date labels, among other factors).
  • "Social-Optimal Household Food Waste: Taxes and Government Incentives" by Bhagyashree Katare,  Dmytro Serebrennikov,  Holly Wang,  and Michael Wetzstein published in the American Journal of Agricultural Economics in 2017 (This paper presents a more developed model than in the Ellison and Lusk paper mentioned above including factors like externalities; they  likewise situate food waste in the context of optimal consumer decision making, considering the effects of various policies on the social well-being).
  • "Examining Household Food Waste Decisions: A Vignette Approach", a working paper by Brenna Ellison and me (This paper uses vignettes to study how food waste behaviors vary with various economic variables and consumer demographics).
  • "Foodservice Composting Crowds out Consumer Food Waste Reduction Behavior in a Dining Experiment", a working paper by Danyi Qi and Brian Roe (This paper also constructs an economic model of food waste behavior and studies how consumers' waste behaviors respond to information about whether waste is composed).
  • "Food loss and waste in Sub-Saharan Africa: A critical review", by Megan Sheahana and Chris Barrett published in Food Policy in 2017 (This is a helpful review paper that discusses the economics of food waste in a developing-country context; the focus is much broader than just considering household food waste, which is the focus of many of the above papers). 

There are no doubt other papers out there on the subject.  Let me know what I've missed.


Sources of Food Waste

Which types of food are responsible for the most food waste?  This was a question I attempted to answer with my monthly Food Demand Survey (FooDS) back in January.  There we found that people stated that they tend to waste the most fresh fruits and vegetables followed by bread and bakery products followed by dairy followed by meat.  

I recently ran across this paper by Heller and Keoleian in the Journal of Industrial Ecology.  Their answer to this question is: it depends how you measure it.  

The following figure is from their paper.  The pie chart in the upper left-hand corner is waste measured per pound of food produced.  This measure matches up quite well with my consumer survey: fruits and vegetables are the highest waste categories representing 19%+14%=33% of all the pounds wasted. By this measure, meat represents a small fraction of the total waste.

However, fruits and vegetables don't provide many calories.  The panel on the upper right-hand side of the chart is food waste measured per calorie of food produced.  Now, fats ad oils are the biggest culprit and followed by grains.  By this measure, fruits and vegetables and most meat products are only a small fraction of waste.  

The last pie-chart on the bottom of the figure measures waste per unit of greenhouse gas emitted.  Because beef is a ruminant and produces methane during digestion, it is a relatively large contributor of greenhouse gasses.  As a consequence, when measured in terms of greenhouse gases, beef, veal, and lamb appear as the biggest contributors of food waste followed by dairy.  

So, which measure is the "right one"?  I suppose that depends on whether you're most concerned about lost food pounds, lost food calories, or lost greenhouse gases.  

P.S.  The Heller and Keoleian paper has another fascinating and surprising result.  They simulate what would happen if people kept eating the same calories but instead shifted to eating the way suggested in the federal Dietary Guidelines.  The result?  A 12% increase in diet-related greenhouse gas emissions.  

What do meat eaters and vegetarians spend on food?

Bailey Norwood and I have a new paper forthcoming in the journal Ecological Economics that seeks to identify how much money vegetarians spend on food relative to meat eaters.  This issue is of interest because food costs are often a reason touted for reduced meat consumption.  The argument is that meat is expensive and thus eschewing meat (or participating in meatless Monday, for example) will save you money.  Here additional motivation for the work:

The implications of the dietary costs of vegetarians goes beyond the impacts on one’s wallet—it will help determine the carbon footprint of meat, dairy, and eggs. If a vegetarian spends less on food, what do they do with their remaining income? And do those other purchases have higher or lower carbon impacts? If vegetarian diets have both a lower carbon footprint and a lower price-tag, then one cannot really determine the carbon impact of becoming a vegetarian without accounting for how those food savings are spent. If vegetarians spend 15% less on food but use those savings on a plane flight, then their overall carbon footprint might rise. Indeed, Grabs (2015), who labels this a “rebound effect”, found that half of the carbon footprint reduction attributable to a vegetarian diet actually disappeared after accounting for the carbon effects of the remaining expenditures. Like Berners-Lee, Grabs infers the expenditure patterns of vegetarians using an amalgamated dataset using inferred (rather than observed) prices paid by each individual, where US data on the differences between the diets of vegetarians and omnivores based on Haddad and Tanzman (2003) is assumed to hold true for Swedish citizens.

Even if the cost of food isn’t a prime reason typically given to adopt vegetarianism, environmental impacts are, and what Grabs shows is that the two items are related. A better understanding on the relationship between vegetarian diets and food expenditures is thus warranted not just because it helps us understand the monetary consequences of altering our diets, but the environmental consequences as well.

We used data from my monthly Food Demand Survey (FooDS) to determine how much vegetarians report spending on food at home and away from home compared to meat eaters. The analysis is complicated by several factors.  First, many of the people in our survey who say they are vegetarian or vegan actually choose a meat item in a prior portion of the survey that simulates a shopping experience (perhaps because someone else in their household eats meat).  Thus, we conduct our analysis separately for "true" vegetarians (about 2.2% of the sample) and "partial" vegetarians (about 3% of our sample).  Secondly, vegetarians/vegans differ from meat eaters in a variety of ways, such as gender, political ideology, income, etc.  This raises the question of whether differences in gender, income, etc. explain differences in spending patterns or whether it is dietary choices.  Moreover, while one can change from from a meat eater to vegetarian, one cannot (easily) change from male to female, very conservative to very liberal, or black to white.  Thus, we conduct several counter-factual simulations where we ask what happens if one converts to vegetarianism but retains their prior demographic characteristics vs. someone who differs in both regards.  

Here are some summary statistics on distribution of spending by meat eating status (not controlling for demographic or income differences)

It appears "partial vegetarians" spend more on food than the other two groups, however, when one looks at the demographics this group is also a bit richer, is more likely to have children in the household, and has larger household size - all things that are correlated with higher food expenditures.  

After adjusting for differences in demographics, we continue to find differences in spending patterns, though the differences are typically smaller.  Here are some graphs I constructed using the estimates in the paper. The figure shows spending for each consumption group assuming each group has demographics equal to the mean demographics in the sample (i.e., each group has the same demographics) for different levels of income.  

In general, richer households spend more on food than poor households regardless of whether one eats meat or not.  However, at every income level, partial vegetarians spend more than meat eaters while true vegetarians spend less (assuming same gender, household size, etc.).  For example, for households earning between $60,000 and $79,000 per year, weekly spending on food for meat eaters is $156, for partial vegetarians its $196, and for true vegetarians its $116.

Here is the same result expressed as a share of income (these are the so-called Engel curves).

Meat eaters in households earning between $60,000 and $79,000 per year spend about 11.6% of their income on food for partial vegetarians at the same income level it's 14.5%, and for true vegetarians it 8.5%.

Of course, these three groups don't have the same incomes.  The percent of respondents living in households making more than $100,000/year is 11.3% for meat eaters, 18.3% for partial vegetarians, and 14.4% for true vegetarians.  Thus, if one adjusts for differences in household income, some of the differences shown in the above graphs disappear.

Here is a summary of what we found.

To the extent that self-reported food expenditures are reliably correlated with actual expenditures, true vegetarians spend less money on food than meat eaters and partial vegetarians spend more. Although this result might be used to suggest that meat eaters could replace their meat with vegetables and save around $20 per week in food, this is deceiving. Roughly half of these savings are not due to the change in types of food purchased, but demographic differences. There are certain demographics that one can change in an effort to better mimic true vegetarians. Two of these are body mass index and political attitudes, but although they can be modified by the individual, their impact on food expenditures is small if not zero. The demographic traits that help true vegetarians save money must then reside with more fixed factors like household size, gender, and the like.

Adaptation to Climate Change

I ran across this fascinating paper by Richard Sutch on the the relationship between the Dust Bowl and hybrid corn adoption.  The discussion is interesting in light of current discussions bout how and whether farmers will be able to adapt to climate change and whether technology development can help mitigate some adverse effects.

Here's a passage from Sutch.

The suggestion that I make in this chapter is that the severe drought of 1936 revealed an advantage of hybrid corn not previously recognized— its drought tolerance. This ecological resilience motivated some farmers to adopt hybrids despite their commercial unattractiveness in normal years. But that response to climate change had a tipping effect. The increase in sales of hybrid seed in 1937 and 1938 financed research at private seed companies that led to new varieties with significantly improved yields in normal years. This development provided the economic incentive for late adopters to follow suit. Because post- 1936 hybrid varieties conferred advantages beyond improved drought resistance, the negative ecological impact of the devastating 1936 drought had the surprising, but beneficial, consequence of moving more farmers to superior corn seed selection sooner than they might otherwise.

This long quote is from the conclusions and is well worth reading.

The sociologists Bryce Ryan and Neal Gross, writing in 1950, studied the diffusion of hybrid corn in two communities located in Greene County, Iowa (Ryan and Gross 1950). In their view, late adopters were farmers bound by tradition. They were irrational, backward, and “rural.” The early adopters by contrast were flexible, calculating, receptive, and “urbanized.” “Certainly,” they summarized, “farmers refusing to accept hybrid corn even for trial until after 1937 or 1938 were conservative beyond all demands of reasonable business methods”. They drew a policy implication: “The interest of a technically progressive agriculture may not be well served by social policies designed to preserve or revivify the traditional rural- folk community”. In part, this view was based on Ryan and Gross’s (incorrect) belief that hybrid corn was profitable in the early 1930s. I have suggested that this was not the case. Figure 7.11 should also give pause to the view that rural laggards delayed the adoption of hybrid corn. It would be hard to argue that the farmers in Iowa Crop Reporting District 6 were predominantly forward-thinking leaders, attentive, and flexible, while those in Indiana and Ohio were predominately backward rustics trapped by inflexible folk tradition.

I think an implication of this study is that farmers (even those of rural America in the 1930s) are remarkably resilient and adaptive. Sudden and dramatic climate change induced a prompt and prudent response. An unexpected consequence was that an otherwise more gradual process of technological development and adoption was given a kick start by the drought and the farmers’ response. That pushed the technology beyond a tipping point and propelled the major Corn Belt states to the universal adoption of hybrid corn by 1943. The country as a whole reached universal adoption by 1960.

The paper has a number of interesting discussions about the role of the USDA, federal research, and strong personalities that pushed along the development of hybrid corn.  For more on the history of the development of hybrid corn, see this previous post.