Blog

Consumer perceptions of "healthy" claims

Last week I wrote about a study I conducted on how consumers think about the word “natural.” As a part of the same project, I also delved into consumer’s perceptions of the word “healthy.”

“Healthy”, at least as a food package claim, has been defined by the FDA since 1993 by reference to total fat content, with changes made in 2016 to discriminate between different types of fat. Recently, however, the FDA has begun a process to potentially re-define the term, suggesting the need for more information on consumer’s current perceptions of the term and labeling claim.

One of the first questions on this topic I asked my sample of over 1,200 nationally representative food consumers was an open-ended question: “What does it mean to you for a food to be called ‘healthy’?” A word cloud constructed from the responses is below (the full report is available here). Words like good, fat, nutrition/nutrient/nutritional, natural, sugar, calorie, and organic were most commonly mentioned. Responses provided some support for current FDA definition as “fat” is one of the most commonly mentioned words (mentioned by 10.4% of respondents), although nearly as many (6.6%) mentioned sugar. More than a quarter of respondents provided imprecise or tautological-like definitions like “good ingredients,” “good for you,” or “healthy ingredients.”

healthy1.jpg

In addition to the open-ended question on the meaning of “healthy”, respondents were provided with a list of 13 factors that consumers might use to judge whether a food is healthy. The figure below shows that about a quarter of respondents indicated sugar content and use of hormones or antibiotics, 19.2% pointed to fat content, and 18.4% pointed to pesticide residues. The top four answers included two nutrients (sugar and fat) and two food production processes/ingredients (hormones and pesticides), suggesting consumers consider healthiness to be more than just defined by nutrient content. However, it should be noted that hormones and pesticides were infrequently mentioned (both mentioned by less than half a percent of respondents) when unaided.

healthy2.JPG

To further explore how consumers define and think about healthiness, a couple binary choice questions were posed. Consumers were about evenly split on whether a food can be deemed healthy based solely on the foods’ nutritional content (52.1% believing as such) or whether there were other factors that affect whether a food is healthy (47.9% believing as such). Consumers were also evenly split on whether an individual food can be considered healthy (believed by 47.9%) or whether this healthiness is instead a characteristic of one’s overall diet and the combination of foods consumed (believed by 52.1%). These responses suggests difficulty in creating a definition of “healthy” on food packages that is broadly acceptable to consumers. Answers to these two questions are not determinative of each other, but rather there are four distinct consumer segments with regard to healthy food conceptions. The figure below indicating the percent of respondents who answered these two questions in the four possible manners.

healthy3.JPG

Respondents were also provided a list of 15 foods in random order and were asked to indicate whether each was healthy, unhealthy, or neither healthy nor unhealthy. For each item, a healthiness score was created by subtracting the percent of respondents who considered a process unhealthy from the percent of respondents who considered a process healthy. The figure below shows the results.

Almost all respondents (96.2%) considered fresh vegetables to be healthy, and almost none (0.9%) considered them unhealthy, yielding a net healthy score of 96.2-0.9=95.3% for fresh vegetables. Fresh fruit, fish, eggs, and chicken were likewise broadly considered healthier than not. Frozen vegetables/fruit were considered less healthy than fresh, and canned were considered less healthy than frozen, although even canned was considered, on net, more healthy than unhealthy. Only three of the 15 items listed were considered by more respondents to be unhealthy than healthy: vegetable oil, bakery and cereal items, and particularly candy.

healthy4.JPG

To explore how consumers conceptualized the healthiness of different foods, the questions used to create the figure above were further analyzed using factor analysis. The first factor, shown on the vertical axis of the following figure shows all animal products with high values and other non-animal products with lower values, suggesting consumers use animal origin as a primary factor in judging whether a food is healthy. Another factor illustrated on the vertical axis, indicates freshness or degree of processing is another dimension to healthiness evaluations. These results indicate that healthiness is not a single unifying construct, but rather consumers evaluate healthiness along a number of different dimensions or factors. A food, such as beef or fish, can be seen as scoring high in some dimensions of healthy but low in another.

healthy5.JPG

Respondents were asked to indicate their extent of agreement or disagreement with eight statements. The highest levels of agreement were with the statement, “Individual needs determine whether various foods are healthy for an individual.” Only 7.8% of respondents disagreed with this statement, whereas more than 70% agreed with it. There were also strong beliefs that healthy food is safe to eat and natural. There was only moderate agreement that healthier food is tastier. About 44% of respondents neither agreed nor disagreed with this statement. There was slightly more disagreement than agreement that healthy food is more convenient to eat. A majority of consumers (58%) disagreed that healthy is more affordable.

healthy6.JPG

There is a lot more in the full report.

What is "Natural"?

I recently completed a survey of over 1,200 U.S. consumers to find out exactly what they think “natural” means when evaluating different foods. The full report is available here and topline results for all questions asked are here (the survey also covered consumers’ perceptions of “healthy” claims, which I’ll blog on later).

Here is the motivation for the study:

While food companies are allowed to use a “natural” label or claim, the Food and Drug Administration (FDA) has refrained from defining the term. One consequence has been a large number of lawsuits in recent years in which plaintiffs claim to suffer harm from being misled about food product contents or ingredients when accompanied with a natural label (Creswell, 2018). In 2015, the FDA requested public comment on the use of the term natural in food labeling, signaling a potential move to define the term. Such events suggest the need for more information about how food consumers perceive and define the term natural.

One of the initial queries was an open-ended question which asked, “What does it mean to you for a food to be called ‘natural’?” Here is a word cloud constructed from the responses.

wordcloud_natural.jpg

Words like artificial, additive, chemical, and organic were most commonly mentioned. More than 10% of respondents specifically mentioned the word artificial. A non-trivial share of respondents suggested the word was meaningless, marketing hype, or that they did not know what the word meant.

Respondents were also provided a list of possible words/definitions and asked which best fit their definition of natural. No preservatives and no antibiotics/hormones topped the list.

natural1.jpg

Despite associating preservatives with lack of naturalness, when asked about specific preservatives, responses are more nuanced. Preservation by canning and with sugar/salt/vinegar were perceived by more people as natural than not-natural, whereas preservation with benzoates/nitrites/sulphites was not.

To hone in on which processes/foods people consider natural vs. not natural, they were shown the following figure. Respondents were asked “Which of the following foods or processes do you consider to be natural? (click up to 5 items on the image that you believe are natural).” The question was repeated except “natural” was replaced with “NOT natural.”

natural2.jpg

You can find some colorful heat-maps of the resulting clicks in the full report. Here, I’ll just note that about half of respondents (47.1%) clicked on the image of the raw commodities as being natural. The next most commonly clicked areas, chosen by between 20% and 30% of respondents, was grits/oatmeal, wash/clean, and wash/grind/slice. Even after showing the processes involved, 19.8% clicked vegetable oil as natural and 13.3% clicked flour as natural. By contrast, “Bleach” was most most frequently clicked (by 33.8% of respondents) as not natural, followed by “Crystalize”, and then alcohol, syrup, and sugar.

A curious result revealed is that, in many case, final foods are often considered more natural than the processes which make them. For example, more people clicked alcohol as natural than clicked fermentation as natural. Vegetable oil was perceived as more natural than pressing or bleaching, both processes which are used to create this final product. Similarly, sugar is perceived as more natural than crystallization, but of course, the latter is necessary to produce the former. These findings suggest that it is possible for a final product to be considered natural even if a process used to make the product is not.

I also asked questions about crop production processes and perceptions of naturalness.

natural3.jpg

About 80% more respondents said organically grown crops were natural as said such crops were not natural. Crops grown indoors and that are hydroponically grown were, on net, seen as more natural than not. All other crop production practices were rated as not natural by more respondents than were rated as natural. Thus, the results suggest consumers are skeptical of the naturalness of most modern crop production practices. Curiously, this is true for use of hybrid seeds. Crops produced with biotechnology were much more likely to be considered not natural than natural. Consumers perceived organic as natural, but not the pesticides used in organic agriculture or the methods (i.e., mutagenesis) used to create many organic seeds. Again, these findings suggest that it is possible for a final product to be considered natural even if a process used to make the product is not; in this case, the finding is likely to result from a lack of knowledge about organic production practices.

On the topic of misperceptions, just because a federal definition of natural exists does not mean consumers know or understand the definition. The USDA currently defines “natural” for meat products, and it is primarily defined as “minimally processed.” However, only about a quarter of respondents in this survey (26.6%) correctly picked this definition when asked how the USDA defines the term. More than 30% of respondents incorrectly believed the USDA definition of natural implies “no hormones” and 23.8% thought a natural label implies “no antibiotics.” These data suggest more than half of respondents are misled by the USDA definition of natural, a result supported by the other recent academic research.

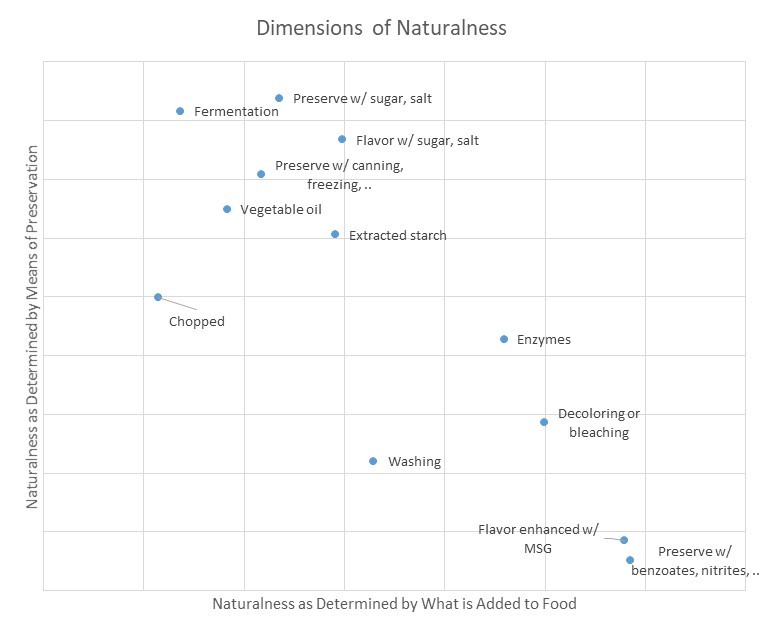
There is a lot more in the detailed report, including more information on question wording and methods of analysis. For example, analysis of correlations between responses (via factor analysis), suggests “natural” is not a single monolithic construct in consumer’s minds, but rather is multidimensional. A food or process can be considered natural on one dimension but not another, as shown in the following figure.

natural4.jpg

Thanks to the Corn Refiners Association, who funded this survey. They gave me free reign to ask the questions and analyze the data as I wanted. You can see their interpretation of the results and their policy recommendations here.


Market Impacts of GMO Labeling

Readers might recall the result from the study Jane Kolodinsky and I published in Science Advances earlier this year. We found that the provision of mandatory labels in Vermont appears to have reduced opposition to GMOs in that state. However, as I noted at the time,

Our result does NOT suggest people will suddenly support GMOs once mandatory labels are in place.

Indeed, the data suggest consumers will still want to avoid products with GMO labels, which provides incentives for food retailers and manufacturers to find ways to avoid GMO ingredients.

Colin Carter and Aleks Schaefer just published an interesting new study in the American Journal of Agricultural Economics, which powerfully shows that mandatory GMO labels are already having significant market impacts. They found a creative way to explore this issue by focusing on the market for sugar. They provide the following background:

In the United States, sugar is produced from both sugarcane and sugarbeets. Sugarcane stalks are milled to produce raw sugar. Raw cane sugar is then sent to a refining facility to be transformed into refined sugar. Sugbarbeets, in contrast, have no raw stage; they are processed from beet to refined sugar in one continuous process. The U.S. market share for beet (cane) sugar is approximately 58% (42%). Almost all U.S. sugarbeet production is GE, while cane sugar is GE-free. However, sugar derived from beets is chemically identical to sugar derived from cane.

This summary data they provide on prices of sugar from cane and beet sources suggests “something” change around the same time as the Vermont mandatory GMO labeling law.

Source: Carter and Schaefer, American Journal of Agricultural Economics

Source: Carter and Schaefer, American Journal of Agricultural Economics

Here are the main findings.

Our analysis supports the explanation that the divergence in U.S. prices for refined cane and beet sugar was the result of Vermont’s mandatory GE labeling. The divergence occurred on or around July 2016— the month the Vermont Act took effect.

Counterfactual price estimates generated by a regression model suggest that GE food labeling initiatives generated a small premium for cane sugar and a price discount for beet sugar of approximately 13% relative to what prices would have been in the absence of such legislation.

These changes in raw ingredient prices will ultimately have impacts on retail food prices. All this is suggests that mandatory labels aren’t a free lunch.

Dealing with Lazy Survey Takers

A tweet by @thefarmbabe earlier this week has renewed interest in my survey result from back in January 2015, where we found more than 80% of survey respondents said they wanted mandatory labels on foods containing DNA. For interested readers, see this discussion on the result, a follow-up survey where the question was asked in a different way with essentially the same result, or this peer-reviewed journal article with Brandon McFadden where we found basically the same result in yet another survey sample. No matter how we asked this question, it seems 80% of survey respondents say they want to label foods because they have DNA.

All this is probably good motivation for this recent study that Trey Malone and I just published in the journal Economic Inquiry. While there are many possible reasons for the DNA-label results (as I discussed here), one possibility is that survey takers aren’t paying very close attention to the questions being asked.

One method that’s been around a while to control for this problem is to use a “trap question” in a survey. The idea is to “trap” inattentive respondents by making it appear one question is being asked, when in fact - if you read closely - a different question is asked. Here are two of the trap questions we studied.

trapquestions.JPG

About 22% missed the first trap question (they did not click “high” to the last question in figure 2A) and about 25% missed the second question (the respondent clicked an emotion rather than “none of the above” in question 2B). So far, this isn’t all that new.

Trey’s idea was to prompt people who missed the trap question. Participants who incorrectly responded were given the following prompt, “You appear to have misunderstood the previous question. Please be sure to read all directions clearly before you respond.” The respondent then had the chance to revise their answers to the trap question they missed before proceeding to the rest of the survey. Among the “trapped” respondents, about 44% went back and correctly answered the first question, whereas about 67% went back and correctly answered the second question. Thus, this “nudge” led to an increase in attentiveness among a non-trivial number of respondents.

After the trap questions and potential prompts, respondents subsequently answered several discrete choice questions about which beer brands they’d prefer at different prices. Here are the key findings:

We find that individuals who miss trap questions and do not correctly revise their responses have significantly different choice patterns as compared to individuals who correctly answer the trap question. Adjusting for these inattentive responses has a substantive impact on policy impacts. Results, based on attentive participant responses, indicate that a minimum beer price would have to be substantial to substantially reduce beer demand.

In our policy simulations, we find a counter-intuitive result - a minimum beer price (as implemented in some parts of the UK) might actually increase alcohol consumption as it leads to a substitution from lower to higher alcohol content beers.

In another paper in the European Review of Agricultural Economics that was published back in July, Trey and I proposed a different, yet easy-to-interpret measure of (and way to fix) inattention bias in discrete choice statistical models.

Taken together, these papers show that inattention is a significant problem in surveys, and that adjusting results for inattention can substantively alter one’s results.

We haven’t yet done a study of whether people who say they want DNA labels are more or less likely to miss trap question or exhibit other forms of inattention bias, but that seems a natural question to ask. Still, inattention can’t be the full explanation for absurd label preferences. We’ve never found inattention bias as high as the level of support for mandatory labels on foods indicating the presence/absence of DNA.

GMO labels - not as bad as I thought

Science Advances (the open-access version of Science Magazine) just published a paper I co-authored with Jane Kolodinsky from the University of Vermont.  I suspect the paper's findings may raise a few eyebrows, as we find that opposition to GMOs in Vermont fell relative to that in the rest of the U.S. after mandatory labeling was adopted in that state.

Some background context might be useful here.  Several years go, I was decidedly in the camp that thought imposition of mandatory labels would cause people to be more concerned about GMOs because it would signal that something was unsafe about the technology.  Prominent scholars such as Cass Sunstein have argued the same.  A few years ago, Marco Costanigro and I put this hypothesis to the test in a paper published by Food Policy, and we found little evidence (in a series of survey-based experiments) that the label per se neither increased or decreased aversion to GMOs.  So, I was less convinced that this particular argument against mandatory GMO labeling was valid, but I was still unsure.  

Then, last summer at the annual meetings of the Agricultural and Applied Economics Association (AAEA), I saw Jane present a paper based on survey data she collected in Vermont before and after mandatory labels went into place there.  Her data suggested opposition to GMOs fell at faster rate after mandatory labels were in place.  Despite my findings in Food Policy, I remained dubious and Jane and I went back and forth a bit on the robustness of her findings. 

I'd been in enough conversations with Jane to know that we had different philosophical leanings about the desirability of GMOs, but this was an empirical question, so we put our differences aside and decided to join our data and put the hypothesis to the test.  Through the Food Demand Survey (FooDS), I had been collecting nationwide data on consumer's concerns about GMOs, and I suggested we combine our two sets of data and do a true "difference-in-difference" test: Did the difference in concern among consumers in VT and the result of the US increase or decrease after mandatory labeling was adopted in VT?

Our article in Science Advances has the result:

This research aims to help resolve this issue using a data set containing more than 7800 observations that measures levels of opposition in a national control group compared to levels in Vermont, the only U.S. state to have implemented mandatory labeling of GE foods. Difference-in-difference estimates of opposition to GE food before and after mandatory labeling show that the labeling policy led to a 19% reduction in opposition to GE food. The findings help provide insights into the psychology of consumers’ risk perceptions that can be used in communicating the benefits and risks of genetic engineering technology to the public.

One important caveat should be mentioned here.  Our result does NOT suggest people will suddenly support GMOs once mandatory labels are in place.  Rather, our findings suggest that people will be somewhat less opposed than they were prior to labels.  I mention this because in the wake of my paper with Marco in Food Policy some of the media's interpretation of our results (such as that of the New York Times editorial board), could have been construed as suggesting that imposition of mandatory labels would not cause economic harm.  That may or may not be true.  But, this new study suggest that labels per se may in fact reduce opposition.

It was great to work with Jane on this project, and for me it was a good lesson to test your beliefs, particularly when there are theoretical reasons that could support the opposing point of view.

I'll end with a key graph from the paper.

gmo_labels.JPG