Blog

Innovation in Gene Editing and Plant Breeding

Yesterday I had the privilege of moderating a panel discussion focused on gene editing hosted by the Farm Foundation. The main speakers included:

  • Allen Van Deynze, Ph. D., Director, Seed Biotechnology Center and Associate Director, Plant Breeding Center, University of California, Davis

  • Richard Lawrence, Ph.D., Head of Genome Editing, Yield, Disease, and Quality Research, Bayer Crop Science

  • Fan-Li Chou, Ph. D., Senior Vice President, Scientific Affairs and Policy, American Seed Trade Association

  • Alison Van Eenennaam, Ph.D., Professor of Cooperative Extension in Animal Biotechnology and Genomics, University of California, Davis

You can watch the presentations and discussion here or at the video link below.

Slump in Sales of Meat Alternatives

A few days ago, Beyond Meat released their quarterly earnings report and indicated lower than expected profits and sales, leading to a tumble in the firm’s stock price. On Twitter, Julian Melletin noted the firm lost $1.25 for every $1 sold, and he showed some interesting data on the history of sales over the past few years.

Beyond Meat is just one company, and it would a mistake to take these headlines and draw broad conclusions about the market trends surrounding plant-based meat alternatives. After all, Beyond Meat might be losing sales because of new entrants and competition to this space.

There isn’t good public data available on sales of meat alternatives, but IRI (a purveyor of grocery store scanner data) has released a series of interesting dashboards showing aggregate trends in a variety of grocery categories, including meat and meat alternatives. Here is what their data imply about total sales meats and meat alternatives.

Derived from IRI data at https://indices.iriworldwide.com/covid19/?i=0

Derived from IRI data at https://indices.iriworldwide.com/covid19/?i=0

The figure above suggest the downward trend in meat alternative sales extends beyond Beyond Meat. For example, in the week ending October 31, 2021, sales of alternative meats were down 7% relative to the same week last year in 2020. By contrast, sales of beef are up 5%, chicken up 6%, pork up 8%, and turkey up a whopping 38%.

In addition to reporting sales, IRI also reports changes in prices.

Derived from IRI data at https://indices.iriworldwide.com/covid19/?i=0

Whereas prices of traditional meat items are all up 10% or more relative to the same time last year, the same isn’t true of meat alternatives. Indeed, despite all the headlines about overall food price inflation, the price of meat alternatives is actually lower now than it was a year prior.

The two figures above indicate: 1) prices of meat alternatives is down and 2) sales of meat alternatives are down. Taken together, these two facts are strong evidence that demand (i.e., consumers’ willingness-to-pay) for meat alternatives has fallen.

Why is demand for meat alternatives down relative to the same time last year? It isn’t entirely clear. However, note the data above relate only to grocery store sales. It is possible demand is up in the restaurant sector; however, at least in the grocery store, demand for meat alternatives is down. Moreover, the phenomenon can’t be explained by an overall reduction in grocery sales because sales of other meat items is, in fact, now higher than was the case at the same time last year.

Consumer Preferences for Beef Alternatives

The journal Food Policy just published a paper I co-authored with Ellen Van Loo and Vincenzina Caputo entitled, “Consumer preferences for farm-raised meat, lab-grown meat, and plant-based meat alternatives: Does information or brand matter?” I blogged about the working version of this paper this past fall when we finished the first draft, so I won’t re-iterate all the main findings (I should also note the paper at Food Policy is open access, and as such the results are freely available).

What I thought I’d do here is convey some results from the study that are not in the published paper but that are based on the models described therein.

First, a big unresolved question that often comes up when discussing the introduction and evolution of plant-based or lab-based alternatives is whether the the projected market share for the new alternatives is “stealing” sales from beef or rather drawing new people into the market who wouldn’t bought beef to begin with. Using the models estimated in our paper (in the “control” no information, no brand condition), I project that before any alternatives are introduced about 74% of consumers would buy ground beef on a grocery shopping trip (assuming the price is $5/lb) and 26% would refrain from buying ground beef. After the alternatives are introduced (at an assumed price of $9/lb), it is projected about 12% of shoppers would buy one of the beef alternatives. Thus, of the buyers of the new alternatives, I project about 57% (6.9/12.1) would have instead bought conventional ground beef whereas the remaining 43% (5.2/12.1) wouldn’t have bought beef in the first place.

altbeef1.JPG

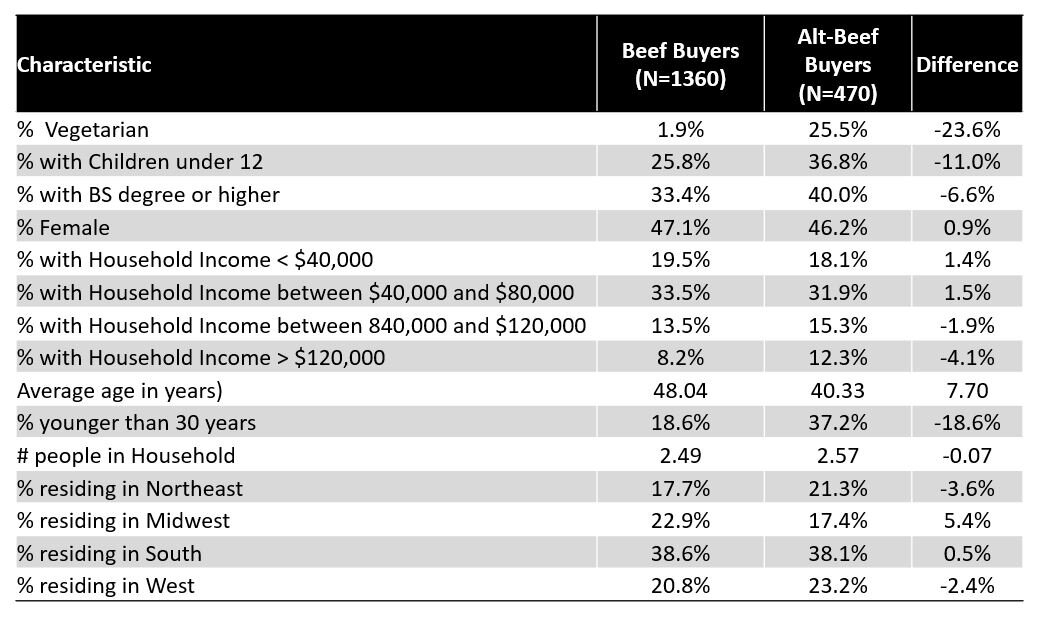
The paper in Food Policy shows some results related to the relationship between demographic characteristics and projections of which alternatives people would buy. To help make these findings a little more digestible, below is a table that shows the demographics of people predicted to choose conventional beef vs. people predicted to choose one of the beef alternatives (assuming all are the same price). Unsurprisingly, the people who are predicted to choose a beef alternative are way more likely to be vegetarian than are people predicted to choose beef. It is also the case that alt-beef buyers are much more likely to be younger and are somewhat more likely to have a college degree than conventional beef buyers. There are not big gender differences.

altbeef2.JPG

The table below shows a similar breakdown but instead of focusing on demographics, I report the importance consumers say they place on 12 different factors when buying food. Predicted beef buyers place greater importance on safety, taste, appearance, and naturalness. By contrast, people projected to buy one of the beef alternatives place more importance on novelty, environment, and animal welfare. (note: in general differences greater than about 0.1 are significantly different than zero at the 0.05 significance level).

altbeef3.JPG

Finally, one of the most interesting results of the survey were responses to open-ended questions we asked about people’s perceptions of the competing products. Here are some word clouds Ellen created.

altbeef4.JPG

These data were collected about a year and a half ago, and given the novelty of the products, it is possible perspectives have changed, particularly following COVID19. Fortunately I have some follow-up work planned with Glynn Tonsor and Ted Schroeder. Be on the lookout for some of those results hopefully some time this coming fall.

Time to give thanks for affordable and sustainable turkey

That’s the title of an article I just wrote for The Conversation.

Here’s the whole thing:

Americans will eat about 210 million turkeys this year, amounting to over 16 pounds per person. Much of that will be eaten on Thanksgiving Day.

Over time, our Thanksgiving meal has become considerably more affordable. Turkey will probably average about US$1.40 per pound across the country in November 2019, which is less than half the price consumers were paying for turkey in the 1970s in inflation-adjusted terms.

How has turkey become so much more affordable? It turns out there isn’t a single factor, but rather a web of innovations.

The truth about turkey

It’s worth dispelling a few myths about the turkey industry first.

All farm-raised turkeys are supposed to be hormone-free.

For one thing, turkeys aren’t given any added growth hormones – doing so is illegal. It’s also illegal to sell turkey with antibiotic residues.

Also, all turkeys are raised cage-free in large, open barns.

Why aren’t more turkeys raised free-range, which means they are allowed to move outside with some freedom? It might initially sound great for turkeys to live outdoors – unless it’s snowing or raining or above 100 degrees.

It might also be fine unless there are roaming hawks, coyotes, dogs – or even wild birds. In 2015, the turkey industry was devastated by avian influenza that cost producers $225 million. Many experts believe the outbreak was caused by the introduction and spread of the disease by wild birds.

Bringing turkeys indoors allows farmers to protect the animals from weather, predators and disease, and it also enables farmers to more closely monitor their diets and health.

Spending less, eating more

Due to innovations in housing and genetics, it now takes less time and less feed to grow a turkey to market weight than it used to.

In the 1970s, the U.S. raised an average of about 125 million turkeys per year and produced about 1.9 billion pounds of turkey meat each year, meaning each turkey produced a little over 15 pounds of meat. This year, the country is projected to produce almost 25 pounds per bird.

This has led to increased affordability for Thanksgiving meals, but it has also had important implications for sustainability.

Let’s suppose Americans want to enjoy the amount of turkey we will actually consume as a nation this year – about 5.3 billion pounds – but we wanted to do that using 1970s technology. How many more turkeys would we need today had we not innovated to increase the amount of meat per bird from 15 to 25 pounds?

The answer is 132 million more turkeys.

That’s 132 million more turkeys that would have emitted waste, created greenhouse gas emissions and required water and feed. Growing that extra feed would have required more land, fertilizer and pesticides.

We were able to save those extra 132 million turkeys because we were innovative and used scientific developments and trial and error to figure out how to satisfy the wants of a much larger population using fewer of our natural resources.

That’s something to be thankful for.

Crop Yields and Taste

That modern agriculture is incredibly productive - much more than the past - is undeniable. These USDA data, for example, suggest we produce about 170% more agricultural output now than in the late 1940s. I have argued that these these increases in agricultural productivity are signals of improved sustainability. Some people believe the the productivity improvements have been accompanied with offsetting externalities or degredations in animal welfare. A different kind of critique is that modern crops - despite being more productive - aren’t as high “quality.” For example, this piece in Politico by Helena Bottemiller Evich, titled “The great nutrient collapse” discuses evidence that vitamin content of crops has fallen as yields have increased, and there is the often-heard complaint that tomatoes don’t taste as good as they once did.

There is some biological basis for these latter concerns. If a crop breeder selects plants for higher yields, they are selecting plants that are spending their energy and nutrients into producing bigger seeds and fruits, which is energy that could have gone (in lower yielding plants) to growing leaves or roots or other compounds that affect taste and vitamin content.

I had these thoughts in the back in my mind when I came across the Midwest Vegetable Trial Report put out by researchers at Purdue and other Midwestern universities. The report compares different vegetable varieties in terms of yield and other output characteristics. I noticed for a couple vegetables - green beans and sweet corn - there were also measures of taste for each variety. Granted, these were not full-on scientific sensory evaluations and they involved small numbers of tasters, but still I thought it would be useful to test the conjecture that higher yielding varieties taste worst.

Some researchers from University of Kentucky put together the green bean report. They compared the performance of 19 different varieties of green beans. The most productive variety (named “Furano”) yielded 785 bushels over six harvests, whereas the lowest yielding variety “Slenderette” only produced 233 bu/acre in six harvests. As the image below reveals, however, there was only a weak correlation between taste and yield. The correlation was negative (-0.26), but not particularly large. About 6.6% of the variation in yield is explained by taste. The best tasting variety “Opportune“ had a taste score of 4.1 (on a 1=poor to 5=excellent scale) and a yield of 557; the worst tasting variety “Bronco” had an average taste score of 2.3 and a yield of 543. So, the best tasting bean had better yield than the worst tasting bean. Overall, the results below provide some weak support for a yield, taste trade-off.

greenbean.JPG

The report also provided production and taste data on supersweet corn (this part was authored by Purdue researchers Elizabeth Maynard and Erin Bluhm). They compared 16 different types of bicolored supersweet corn (they also evaluated two varieties of white and two varieties of yellow, which I’m ignoring here). They had tasters rate “flavor” on a 1 to 5 scale. As the figure below shows, there is actually a positive correlation between flavor and yield, as measured by ton/acre. The correlation is 0.15, but the relationship is weak. The authors also report yield in a slightly different way, ears/acre, and by this measure the correlation is slightly negative (-0.09).

cornyieldflavor.JPG

These results don’t necessarily negate the idea that the taste of vegetables has declined over time as higher yielding varieties have been adopted, but they do suggest that in 2017, among the particular varieties tested and among the few tasters asked, there is only a very weak correlation between taste and yield for green beans and supersweet corn.