- This NYT article by Stephanie Strom discusses an interesting fault line in the organic movement: whether hydroponic crops (which are not grown in soil) can be called organic.
- A couple days ago, the USDA Economic Research Service put out this "chart of of note" showing trends in private and public spending on agricultural research. As the chart shows, public spending has been falling, although private spending has increased.
- The USDA-AMS has started putting out what appears to be a relatively new monthly report on production and prices of cage free and organic eggs.
- The Journal of Economic Psychology has released a special issue I co-edited with Marco Perugini on food consumption behavior. There are 11 articles on a whole host of interesting topics from organic, food labeling, school lunches, nutrition, "fairness", food security, and more.
- More controversy over chicken pricing, this time from the Washington Post. I spoke to some industry folks about this a few days ago, and one thing they highlighted is that the type of chicken priced by the Georgia Dock is quite different (higher quality - contracted in advance) than what is being priced by other indices like the Uner-Barry (chicken parts - in spot markets). Thus, a lot is being made of an apples-to-oranges comparison (even if the apple price report is flawed).
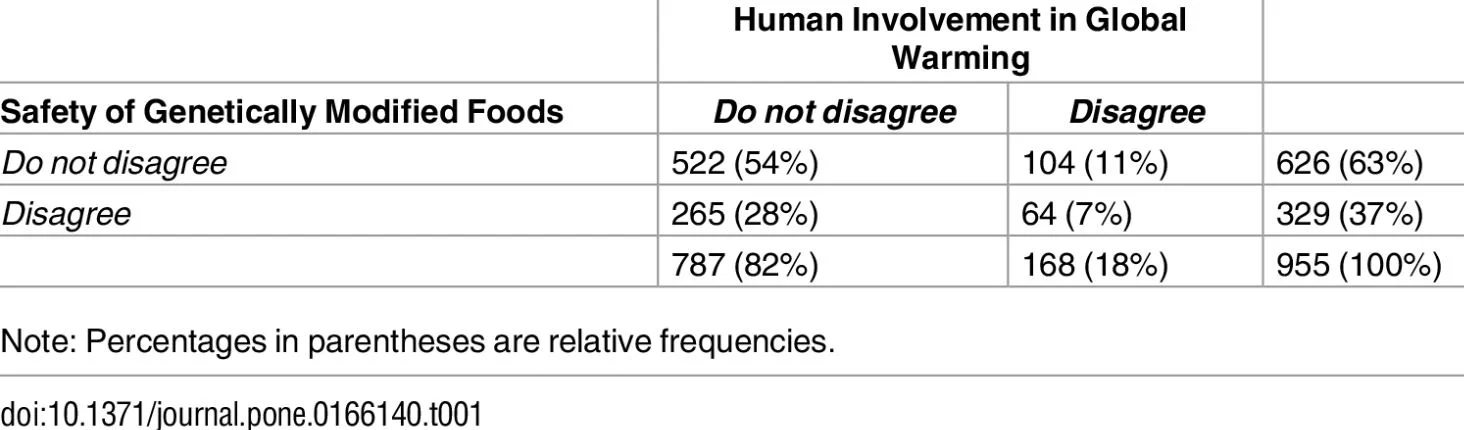
- One of my former students, Brandon McFadden, has a new article in PloS ONE looking at the factors that drive a wedge between public and scientific option about climate change and genetically engineered food. He's got some cool graphs showing people's joint beliefs about climate change and genetically engineered foods, and he explores how those beliefs are affected by cognitive ability, illusionary correlations, objective knowledge, and political party affiliation.
Blog
Food Demand Survey (FooDS) - November 2016
The November 2016 edition of the Food Demand Survey (FooDS) is now out.
The regular tracking portion of the survey suggest lower food demand overall. For example, willingness-to-pay for all meat products fell by at least 8%, and reported spending on food at home and away from home fell by 5.7% and 10.5%, respectively. Some of the WTP declines may be due to post-election uncertainty (the surveys were completed on November 10 and 11). In addition, reported consumer awareness of all 18 issues we track fell in November relative to October as did reported concern for the same set of 18 issues.
Three sets of new ad hoc questions were added this month.
The first question came about as a result of discussion with my OSU colleagues Damona Doye and Dave Lalman who have been exploring some alternative cattle production systems. At issue is what the new systems should be called. Thus, participants were asked: “Imagine shopping at your local grocery store for ground beef. What is the most you would be willing to pay ($/lb) for a package of ground beef that had the following labels? (Note: The current average price of ground beef in the U.S. is around $3.66/lb)”

Participants stated they would be willing to pay the most for ground beef labeled as “grass fed” at an average WTP of $4.26/lb followed by ground beef labeled “organic” at an average WTP of $4. 24/lb. Semi-free range was valued more than semi-confinement ($3.78 vs. $3.28). Participants stated they would pay the least amount for unlabeled ground beef at an average price of $2.92/lb. The sampling error for each WTP value is about +/- $0.15/lb with 95% confidence (thus, if two means are $0.30/lb apart or more, they are statistically different).
Next, participants were asked: “Farmers rely on fertilizers to promote plant growth and grow more food. How desirable or undesirable would you consider it to eat a fruit or vegetable grown with the following fertilizers?” Individuals responded on a five-point scale: 1=very undesirable, 2=somewhat undesirable, 3=neither desirable nor undesirable, 4=somewhat desirable, or 5=very desirable.

The most common answer for each item was “neither desirable nor undesirable”, except for municipal waste where very undesirable was the most common response. On average, fertilizer created through a process that uses natural gas and nitrogen in the air (this is the so-called Haber-Bosch process also called "synthetic fertilizer" by the organic industry) was perceived as most desirable followed by animal manure. Blood meal and municipal waste were rated as the least desirable fertilizer products. The sampling error is about +/- 0.075 with 95% confidence (thus, if two means are apart by 0.15 or more, they are statistically different).
Then, to follow up on this questions, participants were asked: “Which types of fertilizer are allowed in organic agriculture?” Participants could select all that applied.

Over half of the participants (correctly) believed that the use of animal manure as a fertilizer was allowed in organic agriculture. About 38% of respondents (incorrectly) believed fertilizer created through a process that uses natural gas and nitrogen air was an allowed fertilizer in organic agriculture. Only 13% of participants thought that municipal waste was an allowed fertilizer in organic agriculture (see here for a discussion of allowable fertilizers in organic). The sampling error is about +/- 3% with 95% confidence.
A couple comments. First, it is curious that the fertilizer most respondents thought was allowable in organic (manure) only only believed to be allowable by about 50%. It raises the question: how do respondents think organic producers fertilize their crops? Perhaps I should have allowed that as a response option (e.g., something like "no added fertilizers are allowed in organic production"). Second, comparing the two graphs above, it is curious that the most desirable type of fertilizer (created via Haber-Bosch) is disallowed in organic agriculture - a fact that roughly 61% of respondents appear to recognize.
Is Organic Agriculture Taking Over?
A few days ago, the USDA released a new report on the amount of farmland and farm production that is certified organic. I've seen a number of news stories tout the main result from the report summary:
“Certified organic farms operated 4.4 million acres of certified land in 2015, up 20 percent from 2014”
Given the price premiums for organic, I suspect there have been some more conversions over the last year, but I see several things wrong with the way this statistic has been covered. First, what happened to the rest of (non-organic) farm acres in the US? Are they up or down? Second, Politico noticed something interesting about the result:
“Organic acreage might be up 20 percent from 2014, according to the USDA’s 2015 organic census, but it’s not quite the good news the industry was hoping for. The vast majority of the bump — 96 percent of the new acres — is thanks to the certification of 700,000 acres in Alaska. Organic Trade Association spokeswoman Maggie McNeil says the new Alaska acreage stems from a single rangeland certification . . .”
Finally, to get a real sense of the impact of organic production on the agricultural landscape, we need to put the figures in perspective. As it turns out, organic still represents a very small segment of the farm sector. I took the latest USDA organic report and tried to mesh it with other USDA data to figure out what percent of the acreage is organic for a given crop, and what percent of the value of production is organic. I somewhat randomly picked a number of fruits and vegetables to compare and then also pulled out the major commodity crops.*

The above figure suggests that 22.7% of all acres devoted to growing lettuce in the US were certified organic. For eggs, 3.6% were organic. For wheat acres, only 0.7% were organic. Only 0.1% of beef cows were organic, and 001% of hogs and pigs were organic.
It is important to note that the amount of acreage devoted to lettuce, carrots, apples, and snap beans is tiny compared to corn, soy, and wheat. For example, in 2015, about 1.2 million acres were devoted to lettuce, carrots, apples, and snap beans - an amount that is only 1.4% of the amount of land devoted to corn alone. The point is that even though fruits and vegetables seem to have a higher share devoted to organic than commodity crops, because commodity crops account for the vast majority of land farmed , the total or overall share of cropland in organic remains very small. For corn, soybeans, and wheat acreage combined, only 1% of the land is organic.
Here's a similar figure but calculated instead as a share of the value of production (i.e., the share of dollars).

One might expect that organic would represent a larger share of the value of production since prices of organic are higher. Indeed, this is the case for eggs and apples. However, it is important to realize the organic yields tend to be lower. Thus, we tend to not get as much output (or quantity) for each unit of land in production. So, in the case of lettuce, for example, 22.7% of the acres are organic but only 13.6% of the dollars come from organic. I suspect this is a result of lower yields for organic despite the fact that organic commands a price premium.
*Note on the calculations and comparisons: Which numbers should be used in the comparison wasn't always clear, and it also wasn't clear whether the regular USDA production numbers include organic or not (I assumed they did in my calculations, an assumption that, if wrong, would make the organic % higher than it actually is). The organic report provided values for vegetables grown in the open and under protection; I summed the value of production for both types but because no acreage is provided for the production "under protection", the value is not included calculations. For non-organic fruits and vegetables, I summed the production for both fresh and processed. All that said, I tried to make the comparisons as fairly as I could.
Beyonce, Meatless Monday, Gluten, and Organic
Here's the episode of the John Stossel Show on Fox Business in which he asks me about Beyonce, meatless Monday, gluten, and organic. My segment starts at just after the 30 min mark.
Organic Yields and Nitrogen Use
David Tribe has an interesting post on organic crop yields. In short, he asks: from where does the nitrogen come? For organic crops, it's often manure. But, where does that come from? Often from animals fed conventional grains made possible by synthetic fertilizers. He also raises an interesting point about the need to count cover crops as an input into production of commercial organic crops when considering overall productivity.
It is an important point that has been addressed by others such as Adam Merberg who humorously noted now synthetic nitrogen is "laundered" to make it fit for organic agriculture:
“However much nitrogen exists in manure today, much of it has been fixed industrially before being taken up by corn plants and laundered through the guts of conventionally-farmed animals. Vasilikiotis does not explain how that manure might come to be in an organic world. To do so would require demonstrating the potential for sufficient biological nitrogen fixation”
A while back, I discussed some of the issues involved in comparing organic and non-organic crop yields, and included the following figure and explanation:

“Here is the basic point conveyed in the picture above: a non-organic farmer is free to use any of the practices available to an organic farmer (e.g., no-till or low-till farming, cover crops, etc) but an organic farmer can only use some of the practices that are available to a non-organic farmer. Thus, the range of possible production practices, costs, and outcomes for organic must be a sub-set of that of non-organic.
Being an organic farmer implies following a set of rules defined by the USDA. These rules restrict the practices available to an organic farmer relative to a non-organic farmer. Organic farmers cannot use “synthetic” fertilizer, Roundup, biotechnology, atrazine, certain tillage practices, etc., etc. It is a basic fact of mathematical programming that adding constraints never leads to a higher optimum.”