There is a lot of interest in “carbon markets” in agricultural circles. It is a bit of a Wild West at the moment, and there are more unknowns than knowns. Against that backdrop, I thought I’d share this excellent webinar with three of my Purdue colleagues, Jim Mintert, Nathan Thompson, and Carson Reeling. The webinar initially offers a “Carbon Market 101” for folks new to concept before getting into nitty gritty and some of the opportunities and challenges facing those interested in getting paid to sequester carbon in row-crop agriculture. Thorough, timely, and informative!
Blog
Beef, Chicken, and Carbon Emissions
There seems to be rising attention paid to the environmental impacts of meat consumption. Some people see plant-based meat alternatives as one way to address this concern, and they question whether it is possible to see a big shift in the types of “meat” consumers buy. Such a shift, in fact, has occurred over the past fifty years - a period during which we’ve observed a remarkable change in meat consumption patterns.
The figure below shows US per-capita consumption (lbs/person/year) of beef and chicken from 1970 to 2020 based on USDA data. On a retail-weight basis, per capita consumption of beef fell from an annual average of 86 lbs/person in the 1970s to 56.7 lbs/person in 2010s (i.e., from 2010 to 2019) - a 34% reduction. At the same time, chicken consumption went from 38.9 lbs in the 1970s to 86.9 lbs in the 2010s - a 123% increase. Total consumption of these two meats has increased from an annual average of 124.8 lbs in the 1970s to 143.5 lbs in the 2010s.

Using the per-capita consumption data (expressed instead on a carcass rather than retail basis), coupled with additional USDA data on yield (lbs produced per animal) over time, one can infer the number of animals each person in the U.S. eats each year on average.
In the 1970s, the average American ate 14.5 chickens/year, a figure that increased to 22.3 chickens by the 2010s. In the 1970s, the average American ate 0.19 cows/year, a figure that fell to only 0.1 cows/year in the 2010s. Stated differently, it took about 5.3 years for the average American to eat one whole cow in the 1970s; at today’s consumption levels, it takes nearly a decade before the average American eats a whole cow.
What is the impact of this consumption pattern change from beef to chicken on one key environmental measure: greenhouse gas (GHG) emissions ?
One UN Food and Agricultural Organization study indicates that there are 5.4 kg of CO2 equivalent gasses emitted for every kg of carcass weight of chicken meat produced. USDA data indicate the average carcass weight of U.S. broilers over the past decade is about 4.53 lbs/bird (or 2.06 kg/bird). This means, each bird is associated with 11.1 kg of C02. Because consumers are now eating 22.3-14.5 = 7.9 more chickens each year than they were in the 1970s, this means they are also emitting 7.9*11.1 = 87.3 kg more CO2 than in the 1970s (assuming the per-head chicken emissions haven’t changed over time).
Has the reduction in beef consumption been enough to offset the increases in carbon emissions from the increased consumption of chicken? According to one study, roughly 22 kg of CO2 are emitted for every kg of carcass weight of beef produced. Cattle carcass weights have averaged about 804.7 lbs/head (or 365.8 kg/head) for the past decade, meaning each cow generates 8,047 kg of CO2 equivalent gasses. Because U.S. consumers are now eating 0.19-0.1 = 0.09 fewer cows each year than in the 1970s, they are emitting 0.09*8047 = 705.6 fewer kg of CO2 equivalent gasses from beef consumption (again, assuming the per-head beef emissions haven’t changed over time). Some of this reduction is because people are consuming less beef (per-capita consumption feel from 116 lbs to 81 lbs on a carcass weight basis), but also because cattle yields have substantially increased from about 617 lbs/cow in the 1970s to 804.7 in the 2010s) - we are getting more beef from each head of cattle.
So, the average American is emitting 87.3 more kg CO2 from extra chicken consumption but has cut 705 kg CO2 from less beef consumption since the 1970s. Looks like a net carbon win. And one that isn’t even close.
One pushback to this point may be that there are more people today than in the 1970s, so per-capita numbers may be misleading. Throughout the 1970s, the US population averaged 215 million, whereas in the 2010s, population averaged 319.6 million. Taking this into consideration, in aggregate, calculations suggest Americans are today consuming about 4 billion more chickens and 8.3 million fewer cattle than in the 1970s. Using the aforementioned per-head emissions implies we are, in aggregate, emitting 44.7 million metric tons (MMT) more CO2 from extra chickens but 67.1 less MMT CO2 from fewer cattle. Thus, on net, we are emitting 22.4 MMT fewer CO2 equivalent gasses from our aggregate beef and chicken consumption today than in the 1970s. Thus, it still appears a net carbon “win” even adjusting for population change.
While we’re at it, the data used in the above calculations can be used to ask a number of counter factional questions.
What would today’s aggregate GHG emissions from chicken be if we hadn’t increased productivity (or yield) since the 1970s? Answer: 52.7 MMT more CO2.
What would today’s aggregate GHG emissions from chicken be if population staid at 1970s levels? Answer: 25.9 MMT less CO2.
What would today’s aggregate GHG emissions from chicken be if per-capita consumption staid at 1970’s levels? Answer: 48.4 MMT less CO2.
Now the same questions for beef.
What would today’s aggregate GHG emissions from beef be if we hadn’t increased productivity (or yield) since the 1970s? Answer: 78.73 MMT more CO2.
What would today’s aggregate GHG emissions from beef be if population staid at 1970s levels? Answer: 84.67 MMT less CO2.
What would today’s aggregate GHG emissions from beef be if per-capita consumption staid at 1970’s levels? Answer: 112.57 MMT more CO2.
To give some sense of scale, the EPA GHG inventory data suggests all U.S. agriculture was responsible for 628 MMT CO2 equivalent emissions in 2019.
All in all, it seems meat consumption patterns have become much more carbon friendly since the 1970s - that’s not a headline one often sees.
********
Note: One assumption in all the above calculations is that the CO2 emissions per head for both chicken and beef haven’t changed over time. While these factors have no doubt changed, it seems unlikely that they have changed enough over time to overturn the basic beef/chicken comparisons above, but I highlight it here to note that the magnitudes are uncertain. Moreover, I’ve converted measures to a per-head (rather than per pound produced) metric because it strikes me that GHG impacts primarily depend on the size of the animal inventory, and if we can get more meat from each animal in the same amount of time (say, from improved genetics), that wouldn’t necessarily imply greater GHG emissions. All my calculations are in this spreadsheet if someone wants to check me.
Finally, thanks to Jack Bobo who asked me some questions, which prompted the writing of this post.
Consumer Preferences for Labgrown and Plant-Based Meat
With all the news about Beyond Meat’s stock price and the rolling out of the Impossible Burger at Burger King, there has been a lot of speculation about how consumers might response and about the ultimate size of this market. In a new paper with Ellen Van Loo and Vincenzina Caputo, I’m pleased to bring some hard data to the these debates.
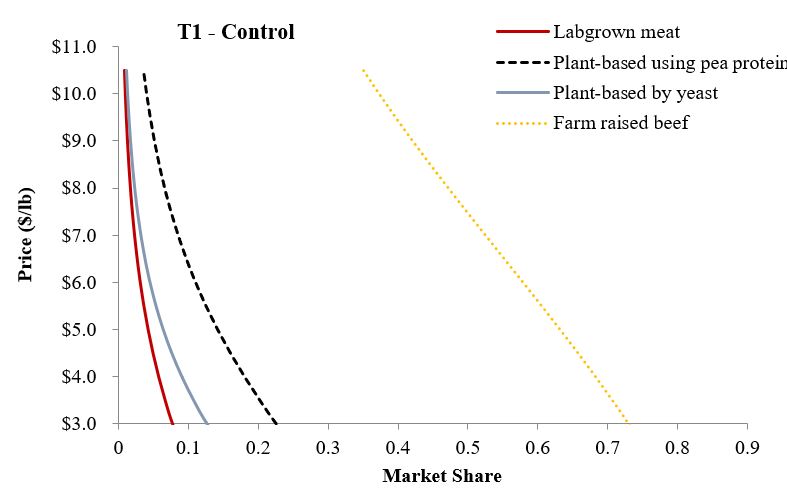
What did we do? We surveyed about 1,800 U.S. food consumers earlier this year and asked them to make a number of simulated shopping choices. In each choice, consumers had five options: conventional farm-raised beef, a plant-based burger made with pea protein (i.e., Beyond Meat), a plant-based burger made with animal-like protein (i.e., Impossible Foods), labgrown meat (i.e., Memphis meats), or they could choose not to buy any of the products (i.e., “none”). Respondents were randomly allocated to different treatments that varied the use of brand names (present/absent) and the information that was provided (none, environment information, or technology information). Here is an example of one of the choices consumers were given (in the treatment that included brands).

So, what did we find? Here is the abstract:
“Despite rising interest in innovative non-animal-based protein sources, there remains a lack of information about consumer demand for these new foods and their ultimate market potential. This study reports the results of a nationwide survey of more than 1,800 U.S. consumers who completed a choice experiment in which they selected among conventional beef and three alternative meat products (lab-based, plant-based with pea protein, and plant-based with animal-like protein) at different prices. Respondents were randomly allocated to treatments that varied the presence/absence of brands and information about the competing alternatives. Results from mixed logit models indicate that, holding prices constant and conditional on choosing a food product, 72% chose farm raised beef, 16% plant-based (pea protein) meat alternative, 7% plant-based (animal-like protein) meat alternative, and 5% labgrown meat. Adding brand names (Certified Angus Beef, Beyond Meat, Impossible Foods, and Memphis Meats) actually increased the share choosing farm raised beef to 80%. Environment and technology information had minor effects on conditional market shares but reduced the share of people not buying any meat (alternative) options, indicating information pulled more people into the market. Even if plant- and lab-based alternatives experienced significant (e.g., 50%) price reductions, farm raised beef maintains majority market share. Vegetarians, males, and younger, more highly educated individuals tend to have relatively stronger preferences for the plant- and lab-based alternatives relative to farm-raised beef. Respondents are strongly opposed to taxing conventional beef and to allowing the plant- and lab-based alternatives to use the label “beef.” ”
We show that even at significant discounts, most people prefer conventional beef. The following demand curves for each of the products illustrates.
A couple weeks ago, I weighed in on the debate about whether these new products can or should be labeled “beef” or “meat.” It seems the U.S. public is far more certain on this than I was.

More details are in the paper.
Because these are new products just hitting the market, it is possible that these preferences can and will change, particularly when more consumers are able to taste them. However, at present, the future market potential for these products appears to fit more in the “niche” category, even at significant price discounts. What will happen in the future? Only time will tell.
Reducing Food Waste - Where's the Incentive?
In recent years, there has been a lot attention being focused on reducing food waste. While I have argued for more nuance than one often sees in popular exhortations to reduce waste, the issue is important: it would be nice to find ways to save all the resources that go into producing food that ultimately winds up in the garbage.
A number of discussions over the past couple months have led to an aspect of this problem that hasn’t received much attention. Namely, what is the incentive of food producers and manufacturers to reduce waste? Or, what are the most effective mechanisms to reduce waste?
One way of reducing waste is what we might call the “demand side” strategy. Try to convince consumers to consume all of what they buy and throw out less. Our stomachs and pantries are only so large, and as a result, this presumably means consumers would ultimately buy less food. In economic terms, this leads to a downward shift in demand, which results in lower prices and less food sold. For producers, this is certainly a bad outcome: selling less food at lower prices means lower revenues and profits. From the perspective of a food producer, all they care about is whether the product sells. What you do with it after you buy it is of little consequence to the seller. As such, one might wonder how much incentive food producers and sellers have to reduce waste, at least via this demand side strategy. To boot - we don’t know for sure whether consumers are better or worse off. They pay lower prices but also buy less food, and as a result the impacts on consumers is ambiguous.
A different way to try to reduce food waste might be called a “supply side” strategy. One challenge with popular conceptions of food waste is that they seems to imply there are large inefficiencies in food supply chains. That some people seem to indirectly imply that farms, food manufacturers, and grocers are losing or throwing out food that they could profitably sell. To be sure, there are likely some inefficiencies in the food supply chain, but food and ag are tend to be competitive, low margin businesses which makes it hard to believe they’re leaving dollar bills lying around that they could easily pick up. To incentivize these firms to reduce waste, loss, and spoilage, something has to change to reduce the cost of preservation. That “something” is likely investment in research and the creation of technologies that enable farms and food manufacturers to affordably make use of food that might otherwise have been unsalable. An old example might be the advent of canning or refrigerated rail cars. More modern examples might include better grain storage bins or storage management practices, vacuum packaging, high pressure pasteurization, etc.
In economic terms, these technologies can be conceptualized as shifting the supply curve downward shift - i.e., lowering the marginal cost of delivering a given quantity of food to the market. Such a shift would lower the price of food while enabling more more food to be sold. Consumers are definitely better off: they get to have more food at lower prices. Whether producers as a group are better off from the supply shift depends on how sensitive producers and consumers are to price changes, but producers who are early adopters of the new technology are almost certainly better off.
Whether the demand-side or supply-side strategy leaves “society” better off (at least as defined by producer profits and consumers’ economic well-being) is not completely predictable because it depends on relative elasticities of supply and demand for the foods in question, among other factors. Ignoring any externalities from food that is thrown out, I would generally expect the “supply side” strategy to be better: we know it makes consumers better off and likely makes producers better off too (though not always). But, it ultimately results in more food being sold and potential (and perhaps ironically) more consumer waste. So, the big unanswered question is the nature and size of the “externality” of food thrown away.
Producing More with Less
I’ve given a lot of talks over the past couple years about the importance of increasing agricultural productivity. Often these discussions get couched in Malthusian terms related to the need to produce more food for a growing world population. This 2009 document from the United Nations Food and Agricultural Organization, for example, suggests agricultural production in developed countries needs to double by 2050 to meet the demands of expected population growth.
I’ve been in enough of these conversations at this point to know that a common retort is that we already produce more than enough food to feed today’s population. Isn’t this just an issue of distribution rather than supply? I’ve addressed this issue in previous posts. Here, I want to draw out an implication of productivity growth that is probably obvious to many academic economists, but perhaps not as widely appreciated as it should be.
In particular, when we talk about increasing productivity enabling us to “do more with less,” the focus is often on the “do more” part. That is, increase food production. But, one shouldn’t forget the “with less” part. In short, increasing productivity means producing more sustainably.
To illustrate, consider the figure below (this is what we economists call a production function).

The bottom, lighter blue curve shows the relationship between various inputs (land, water, fertilizer, labor, etc.) and output (or food production). The figure shows that we can produce more food by adding more inputs - more land, more water, etc. However, there are diminishing returns. The first few gallons of water (or rain showers) produce a lot of extra bushels, but the next few gallons have a smaller effect. In fact, if we get too much water (i.e., a flood, as some parts of the Midwest are currently experiencing), production can actually fall. Diminishing marginal productivity was at the heart of the Malthusian concern - if we keep adding more population (or workers) to a fixed amount of land, the extra amount of food that will be produced (and available per worker) will fall, and hunger will ensue.
How do we escape this “trap”? Scientific research, innovation, and entrepreneurship allow us to shift up to a higher curve, as shown by the darker blue curve in the above graph. For a given amount of inputs (labor or land), we might actually have more food per person (now and on into the future as long as we continue to innovate and shift the curve outward).
Let’s, say, however, that one already thinks we produce “too much.” We don’t want any more food. Ok. I’ve drawn the vertical dashed line in the above figure to show a constant amount of food production. But look where this line intersects with the production functions. The figure shows that higher productivity curve allows us to use fewer inputs (less land, less water, less fertilizer, fewer pesticides, etc.) to produce the same amount of food as compared to the original lower production function.
The point? Even if one believes the problem of production is “solved”, don’t still want to find innovative ways to increase productivity to reduce our use of scarce natural resources?
So, how has US agricultural productivity fared? Here is data from the USDA Economic Research Service.

The figure shows that agricultural output has grown by factor of about 2.7 (i.e., we’re producing about 170% more food) since 1948, while use of agricultural inputs, in aggregate, have grown very little and is essentially flat. The gap between the output line at the top and the input line on the bottom is the definition of productivity.
How will this graph look in 2050? Is it possible the trend lines for outputs and inputs can flip? That is, flat output and falling inputs? If total output stays relatively constant, but we can find ways to improve productivity, then total input use will fall. That would be a great sustainability story.