Blog

Consumer Food Insights - April 2022

The April 2022 edition of our Consumer Food Insights report is now out.

A few highlights from this month:

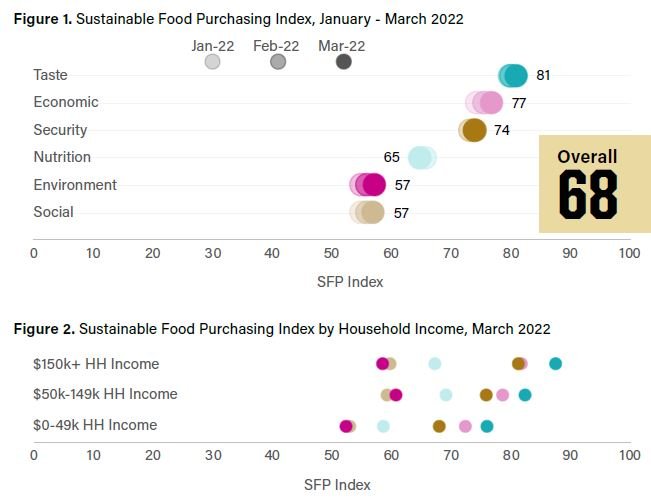
  • The Sustainable Food Purchasing (SFP) index is up about 2 points since January

  • Consumer food spending fell slightly from March to April but remains about 9% higher than in January

  • Food insecurity rates are the lowest we’ve measured since the survey started

  • 46% of consumers have heard of the recent bird flu outbreaks; 60% are concerned about the impact on food prices

  • This month, we did a deeper dive into differences in behavior of urban vs. rural consumers. Rural consumers are more likely to be food insecure and are less happy with their diets as compared to urban consumers.

Finally, I’ll note that we’ve created our first data dashboard to explore current and past editions of the Consumer Food Insights survey. This dashboard focuses on the questions we ask about shopping and eating habits, and allows the user to see how these vary by demographic characteristics and by month of the survey. For example, the screenshot below shows propensity to buy organic food by income. Play around with the data yourself.

P.S. Kudos to Sam Polzin for his excellent work on the survey administration and reporting and to Anna Subramaniam for work on the data dashboards.

Bird Flu - Again

It was about this same time of year back in 2015 when bird flu raised it’s ugly head (see what I wrote about it here or here), and the basic economic principles outlined then apply to the re-appearance of bird flu that we are now seeing in U.S. turkey, layer, and broiler flocks. What differs today are the magnitudes. To what extent can bird flu explain some of the rising poultry and egg prices currently being witnessed?

USDA APHIS tracks confirmations of cases of the most recent spate of bird flu, with the first case reported on February 8, 2022. Many of the reported cases involve small number of birds from backyard flocks (highlighting the fact that some of the spread occurs via wild birds). Focusing on commercial flocks, there have been 3.6 million turkeys affected, 2.1 million chicken broilers (i.e., "meat chickens”) affected, and 16.8 million egg layer chickens affected.

These sound like large numbers, but how do they compare to total U.S. inventory of these birds? If I compare the bird flu cases to USDA data on the typical amount of production that has occurred over the past couple months, data suggest bird flu has adversely affected about 10% of turkey production, 0.1% of broiler production, and 4.3% of egg production.

As I described here, the impact of these supply reductions will have on prices depends on the price-elasticity of consumer demand (i.e., the level of consumer sensitivity to price changes). It’s often thought that egg demand is highly inelastic (i.e., consumers aren’t very sensitive to egg price changes), in part because there aren’t many good substitutes for eggs. As a result, small-ish supply shocks can translate into large price changes for eggs. For example, assuming a price elasticity of demand of -0.15 for eggs, a 4.3% reduction in quantity supplied would be expected to lead to a (0.043/0.15)*100 = 28.7% price increase.

The actual egg price increased we’ve observed are higher than this. The figure below shows wholesale egg prices going back to January 2010. As of April 9, 2022, wholesale egg prices are 74% higher than at the first of the year and about about 166% higher than at the same time one year ago in 2021. Obviously, there’s more than bird flu affecting egg prices. General inflationary trends, increased egg demand around Easter, higher feed and fuel prices, and more are contributing to the current spike above and beyond bird flu.

Likewise, the current chicken price increases can’t be much explained by bird flu because such a small share of broiler chickens have been affected by it. Other factors must be at play.

Curiously, the industry that’s been most affected by bird flu - turkey - is experiencing the slowest rate of price increases. Since the 1st of the year, USDA data suggest wholesale prices for whole frozen turkeys are “only” up about 10%, whereas wholesale fresh turkey prices have actually fallen a bit since early January.

In short, while bird flu is devastating for those producers who have flocks affected, the avian disease doesn’t seem to be a major culprit in the current price changes we’re seeing in turkey, eggs, and chicken.

Of course, that could change if more flocks are affected in the future, so stay tuned.

If you want to see what’s happening to retail food prices, check out our data dashboards at the Center for Food Demand Analysis and Sustainability at Purdue.

Consumer Food Insights - March 2022

The results from the March edition (now issue #3) of our newly launch Consumer Food Insights (CFI) survey from the Center for Food Demand Analysis and Sustainability (CFDAS) at Purdue are now available.

This month, we continued tracking many of the key measures I’ve discussed in previous months. Here are some highlights:

  • The Sustainable Food Purchasing (SFP) Index was unchanged from last month and it is at 68 out of 100.

  • There was a slight decrease in the the share of consumers indicating they couldn’t find specific foods at the store (a fall from 25% to 21%) from February to March

  • Total food spending increased by 8% from last month

  • At present, we find consumer food demand is price insensitive.

This month’s report has several new analyses and questions. First, we conduced a deeper dive into how responses varied by consumer income. Higher income consumers tend to rate the sustainability of their diets as higher than do lower income consumers, particularly on dimensions related to taste, security, economics, and nutrition. By contrast, there was very little difference in high vs. low income on sustainability dimensions related to social and environment.

In addition to answering questions about how shopping behaviors relate to six sustainability dimensions, we also ask respondents to allocate 100 points to these six dimensions in terms of their importance when buying food. Perhaps not surprisingly, lower income consumers placed a higher weight on affordability than did higher income consumers. By contrast, higher income consumers placed more weight on taste and nutrition than did lower income consumers. There was little income difference in the weight attached to social responsibility, environmental impact, or availability across income categories.

Higher income consumers are happier with their diets and are much less likely to be waiting on their next payment to buy food for their household.

To track whether consumers are beginning to shop in a more price-responsive, or recessionary, manner, we asked if respondents would purchase a basket of brand name groceries priced at $100 or a comparable basket of generic name groceries priced at either $85 or $70 (the amount randomly varied across respondents). Higher income households were much more likely to say they’d choose branded over generic products than lower income consumers. However, for all three income groups, none were particularly sensitive to the change in price of brand vs. generic.

There are also income differences in support for food policies. Lower income households showed more support for policies like increasing funding for ag research, but they showed less support for fast food zoning and sweetened beverage taxes as compared to higher income consumers.

We added several new questions this month related to how food away from home spending varies by different type of outlet (and by in-person vs. drive through vs. delivery), and we added questions about consumers’ beliefs about various food-related issues. There was strong agreement that climate change will impact food prices, and less agreement that GMOs are safe or that plant-based milk is healthier than dairy milk. Perhaps an indication of chemophobia or general distrust of unknown substances, 26% agreed that food with deoxyribonucleic acid (i.e., DNA) is unsafe to eat.

There’s a lot more in the report. Check the whole thing out here.

Dashboard on the Food Service Industries

My team at the Center for Food Demand Analysis and Sustainability (CFDA) at Purdue has created a new data dashboard highlighting the economic profile of the food service industries across the 50 United States.

In terms of total sales and total employment, California, Texas, Florida, and New York lead the pack. For example, in the restaurant sector, California has over $100 billion in restaurant sales and employs over a million people.

However, these are also the most populous states. Which states rank highest on a per-capita basis? DC, Hawaii, Rhode Island, and Maine have the most restaurant establishments per resident. North Dakota, Montana, and Wisconsin have the most drinking places per resident.

Find these, and many more statistics related to the gender, race, and age of employees in the food service industries in the new data dashboard.

Market potential of new plant-based protein alternatives: Insights from four US consumer experiments

That’s the title of a new article, co-authored with Glynn Tonsor and Ted Schroeder, that was just released by the journal Applied Economic Perspectives & Policy.

Here’s the abstract:

This article reports results from four studies determining the US market potential for plant-based meat alternatives in different contexts and settings. The first study shows that a pair-wise choice between beef and a plant-based alternative was not significantly affected by the presence of nutrition facts panels or ingredient lists. A second study, framed as a food service meal choice, reveals that the introduction of a plant-based burger has roughly the same effect on beef sales as does the presence of a chicken wrap. The final two studies estimate own- and cross-price elasticities of retail demand. We find small cross-price elasticities between plant-based patties and ground beef. Each of the aforementioned results varies for regular meat consumers as compared to consumers who self-identify with an alternative diet such as flexitarian, vegetarian, or vegan. Combined, this study increases understanding of the impact presented by plant-based offerings in the US protein market.

A bit more detail from the conclusions …

Regular meat consumers are much less likely than those declaring an alternative diet (vegan, vegetarian, flexitarian, or other) to select a plant-based item when a beef item is available. The median willingness to pay and market share differences are substantial and documented in this research. Characteristics of consumers most likely to select plant-based proteins include younger, those with children under the age of 12 years, having higher household income, residing in a Western state, and affiliating with the Democratic party. Replacing a chicken item with a new plant-based protein offering on a food service menu has a small (less than 3%) impact on the frequency of selecting beef burger meals. Changes in the price of beef and chicken have a much larger impact on consumer decisions to buy beef than the impact of changes in the price of plant-based offerings. This means plant-based burgers are relatively weak substitutes for beef. Plant-based burgers have more elastic demands than hamburger and chicken breast for regular meat eaters. This suggests regular meat eaters will be more responsive to adjusting consumption to plant-based proteins as their prices change.

A key question relates to the ultimate US market share of plant-based protein products. This research indicates that if facing a binary choice between a plant-based alternative and traditional beef, around 25% of consumers select a plant-based alternative. However, a few caveats are worth mentioning. Some of the individuals who choose the plant-based alternative are unlikely to consume much (if any) beef. In this sense, growth in the market share of plant-based alternatives is not entirely coming at the cost of reduced beef demand and indeed if a plant-based alternative simply replaces a substitute competitor (like a chicken sandwich) or reflects overall growth in protein demand, the impacts on beef demand are likely to be negligible. Nonetheless, the fact that roughly a quarter of consumers indicate they would choose a plant-based alternative suggests there is ample room for this market to grow relative to the current position of limited market share. That is, our estimates suggest we will likely continue to witness growth in the plant-based alternative market even if all that changes is increased availability (and prices remain fixed at the status quo and consumer preferences and beliefs remain unchanged). Strong growth rates could occur for plant-based items, yet a smaller market share resulting. In fact, early in the COVID-19 pandemic, this occurred as retail sales of plant-based items jumped, but so did many other protein items (Meatingplace, 2020). Accordingly, plant-based item retail market share declined despite the growth of overall sales—an observation that conveys caution on using market-share measures.