Blog

Consumer Food Insights - October 2022

The results of our October 2022 Consumer Food Insights survey are now out.

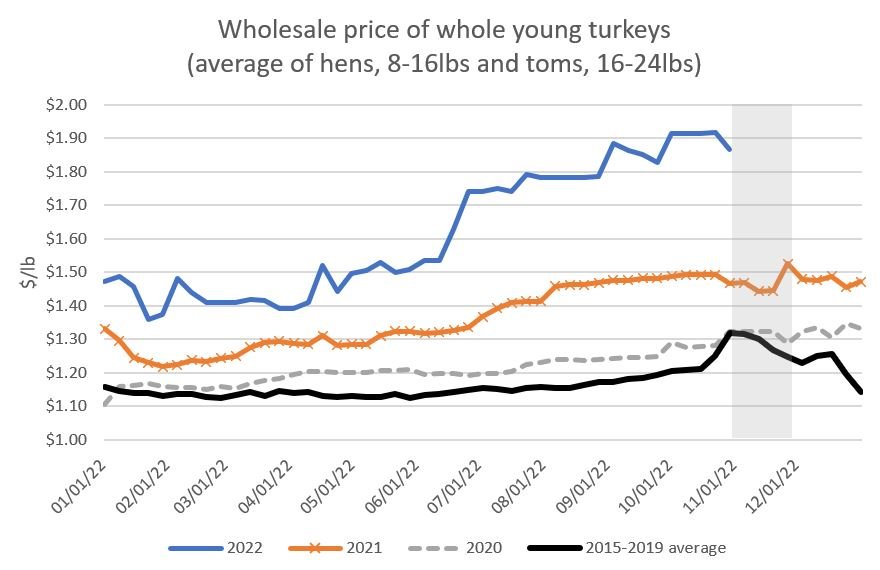
With Thanksgiving right around the corner, we asked consumers about their plans for the holiday relative to last year. 81% of consumers either somewhat or strongly agreed that the price of turkey would be higher this year compared to last. It appears more people than not are expecting smaller gatherings and less travel this year, which perhaps explains (along with the higher price expectations) the result that fewer people than not are expecting to buy a larger turkey this year.

In terms of our overall tracking statistics, we found that food away from home (FAFH) spending declined for third month in a row. However, food at home (FAH) spending remains high and similar to that observed in the the past five months. Perhaps surprisingly, given the high rates of food price inflation, our measure of national food insecurity is at its lowest point of 2022 so far.

Speaking of inflation, my colleague Sam Polzin who manages the survey and data analysis, noted a remarkable correlation between consumers’ inflation expectations measured in our survey and gas prices, as shown in the figure below.

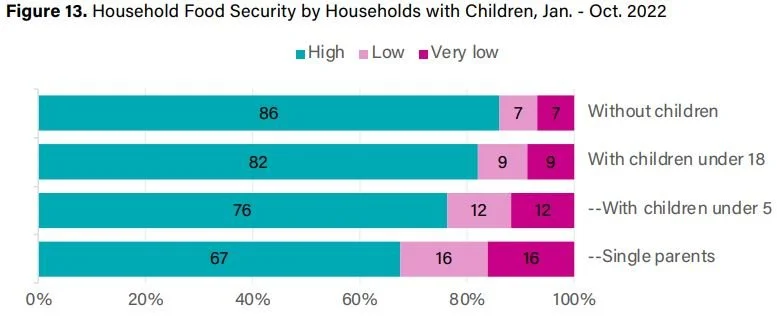
This month, we explored differences in our survey measures between household with and without children. Some of the largest differences were observed for food insecurity. Households with young children and single parents face highest rates of food insecurity.

Finally, we added some questions to compare with a recent Apollo Academic Survey conducted in collaboration with William Masters at Tufts University. That survey asked leaders, fellows, and awardees of the American Society of Nutrition and the Agricultural and Applied Economics Association (i.e., the experts) about their views on nutrition and policy. The survey of experts was motivated, in part, by an article in the Washington Post by Tamar Haspel in which she interviewed Will and me about our views on how to reduce the environmental costs of food production and consumption.

We thought it would be interesting to compare views of experts to those of the general public. The following two figures shows what the general public thinks about several health and nutrition issues. Will, Sam, and I are planning to write a separate piece doing a deep dive into the differences between experts and the public on these matters.

There is a lot more in the full report, which is available here.

Turkey prices - 2022

Last year an article in The Atlantic began as follows:

Jayson Lusk’s Thanksgiving tradition, if you could call it that, is to talk with reporters about the prices of Americans’ holiday groceries.

Well, it’s that time of year again, so we might as well get into it. I’ll focus on the main course: turkey.

Frustratingly, the Bureau of Labor Statistics stopped reporting a retail turkey price a couple years ago in their monthly releases of data surrounding the Consumer Price Index. So, we have to cobble together insights from other sources.

IRI tracks retail grocery store scanner data. Their data dashboard suggests retail turkey prices have been running about 20% higher than last year; however, for the most recent week of data available (the week ending 10/23), retail turkey prices were “only” 9% higher than the same week last year. For some perspective, as of September (the most recent data available), the BLS reported overall annual rate of food price increase at grocery was 13%.

The USDA Agricultural Marketing Service tracks wholesale turkey prices. The figure below shows the trends. At present (last data point is 10/29/2022), wholesale prices for whole fresh turkeys are about $1.87/lb. This is about 21% higher than the same time last year (in 2021) and about 29% higher than two years ago (in 2020).

An interesting feature of the data is that prices tend to fall each year during November (the area shaded in grey). I discussed this back in a post in 2016, where a similar phenomenon was observed for retail prices. Here’s what I wrote then:

This pattern of price fluctuation might be a bit surprising. Isn’t it the case that demand for turkey is highest in November? If so, shouldn’t a demand increase drive up prices? Yes, but producers also know when demand spikes occur and they can plan production and storage accordingly (this is a fairly highly integrated industry) so that there is ample supply during this time. Additionally, research on this topic has suggested that retailers might use turkeys as so-called “loss leaders”. Knowing that many consumers will be shopping for turkeys, retailers will offer specials and discounts on the item everyone is looking for to get them in the door so that they’ll buy all the other things it takes to make a Thanksgiving meal.

Why are prices higher this year? A potential answer is avian influenza (aka “bird flu”). According to USDA-APHIS data, over 7.7 million turkeys have been affected and killed by the disease this year. The figure below show the cumulative number of avian influenza cases this year for egg laying hens, turkeys, and broiler chickens. Many more egg laying hens have been affected than any other types of birds, but as a percent of total production, turkey has probably been hardest hit.

We’ve lost about 5% of total national turkey production because of avian influenza this year. Indeed, USDA data indicates that slaughter of young turkeys through the 1st nine months of 2021 is down about 7% relative to the same period in 2021. In September 2022, turkey production was down 11.4% related to September 2021. Less turkey is being produced, which means consumers are left competing against each other for a smaller quantity, which drives up prices.

On that front, I want to be clear that we don’t have a turkey shortage. In fact, we rarely have shortages of any food product per se (that’s why baby formula issue was such a newsworthy event - it’s unusual!). Price is the mechanism by which agricultural production gets allocated. If fewer turkeys are produced, prices need to rise to ration the quantity produced to those people who value turkeys most. By contrast, if many extra turkeys are produced than expected, prices would need to fall to induce more consumers into buying them. In that sense, price both is the signal of scarcity/abundance and it is also the mechanism that ensures that all the quantity produced is allocated to consumers.

All the other factors driving food prices higher generally are also affecting turkey prices. Corn and soybean (key turkey feedstuffs) are much higher this year than last. Energy prices are higher, affecting costs of transportation, processing, and storage. Wages in the processing and retailing sector are higher too.

The question on everyone’s mind last year: is this the most expensive Thanksgiving ever? My answer this year is largely the same as last year. Prices in the economy tend to rise over time, so prices are almost always higher this year than last. What we want to know is what is happening to consumer buying power. For that, I’ll direct you to the data dashboard we created with the Center for Food Demand Analysis and Sustainability (CFDAS), where you can see trends in nominal prices, inflation-adjusted prices, and in time-prices (i.e., how many hours one has to work at today’s wage to buy a pound of a given food).

One last point that may be of interest. Per-capita turkey consumption has been on the decline for the past few years. Data from the USDA-ERS shows turkey consumption was 15.3 lbs/person/year in 2021, down from 15.7 lbs in 2020, 15.9 lbs in 2019, 16.2 lbs in 2018, and 16.5 lbs/person/year in 2017. Per-capita turkey consumption fell every year during this period. From 2017 to 2021, per-capita turkey consumption fell over a pound, a 6.9% reduction. Some of this was likely pandemic related. More people worked from home, meaning they weren’t packing or ordering turkey clubs and sandwiches. But, the downward trend started prior to the pandemic. Falling per-capita consumption can sometimes be a results of shifts in cost and supply, but the data seem to suggest this is a downward shift in demand. This downward shift in demand, coupled with higher prices, likely means fewer turkeys on the Thanksgiving table this year.

Consumer Food Insights - September 2022

The latest results from the Consumer Food Insights survey from the Purdue Center for Food Demand Analysis and Sustainability (CFDAS) are now out.

This month, we explored consumers’ conceptions of a word that seems all the buzz in the food and agricultural space: regenerative. A small problem with the word: nobody quite knows exactly how it is defined. This tweet and the following back-and-forth a few weeks ago illustrates the point.

So, first we asked our representative sample of U.S. consumers if they knew what “regenerative” meant in the context of food and agriculture. 62% said “no.” 38% said “yes.” Of the minority who said “yes,” we asked them describe the term in a few words. The following word cloud has most common responses.

Then, all survey respondents (regardless of whether they’d said they knew what the word meant) were shown a subset of 13 terms in a series of questions, and were asked, in each question, to identify the term that they most associated and the term they least associated with “regenerative.” This lets us put each of the 13 terms on an underlying scale, which we normalize to range from -1 (least associated with regenerative) to +1 (most associated with regenerative). Respondents most associate “regenerative” with “sustainable” and least associate it with “no-till” (see the figure below). Yet, most surveyed terms score close to 0, particularly among those who report familiarity with the term, indicating that there lacks a clear consumer consensus on how to conceptualize “regenerative.” (The fact that “regenerative” is ill defined reminds me a bit of the arguments I wrote in a post I write about a year ago about the factors driving the ebbs and flows of different fashionable food and and agricultural words and practices.)

In terms of our headline survey measures, we find that food spending remains near its 2022 peak, and food price inflation expectations continue to decline. Food insecurity rates remain steady if not a tad lower than last month.

This month, we did a deep dive into impacts of gender and marriage status. We find that women have higher food insecurity than men, but married women are fairing much better than unmarried women. Similarly, food satisfaction is highest among married men and lowest among unmarried women. Food sustainability behaviors are broadly similar between men and women. Women and singles broadly express more progressive food politics. In terms of trust in information, women distrust McDonald’s and other food companies like Tyson and Nestle more than men. Women also distrust Fox News more, while men distrust CNN more. Married men trust their doctors more than other groups, and married women trust their family members more than other groups. Furthermore, women express slightly more trust for government agencies (FDA/USDA) than men. Married men were most likely to say GMOs are safe to eat (51% indicating as such) while single women were the least likely (only 26%) to believe so

We did NOT find big gender differences in a variety of shopping behaviors such buying organic, checking the nutrition label, buying cage free eggs, or recycling.

There’s lots more in the report. Check out the detailed reporting here.

Increasing pork price sensitivity amidst rising inflation

In some new analysis of retail scanner data, Glynn Tonsor and I find rising price sensitivity of most pork products in the recent era of high inflation. That’s not true for some products - like bacon.

We tackled this issue in a couple different ways, but the table below shows how pork product elasticities have varied on an annual basis since 2017. So, for example, at the aggregate product level, back in 2017, a 1% increase in the price of pork was associated with a 0.78% reduction in the quantity of pork consumers demanded. This year, that same 1% price increase is associated with a 1.18% reduction in quantity demanded. This heightened price sensitivity has coincided with a period of high economy-wide inflation.

You can read the whole report here.

Cost of a Cheeseburger

Apparently National Cheeseburger Day is just around the corner. My team at the Center for Food Demand Analysis has been working hard pulling together data from all across the country on retail food prices (using web-scraping technology), and we thought we’d put the data to use in calculating the price of a cheeseburger by state. Check out the whole infographic here.

To whet your appetite, here are a couple screenshots. First, the comparison across states.

We also compare national averages across regular, organic, and plant-based burgers.