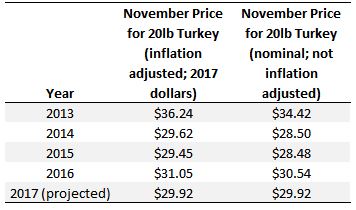
Next week is Thanksgiving, and it seems as suitable a time as any to take a look at changes in food prices. I turned to the Bureau of Labor Statistics (BLS) data to investigate how prices of frozen turkey have evolved over time in the month of November. The BLS hasn't yet reported retail prices for the month of November (or for the month of October for that matter), but nonetheless I can project this year's November turkey price based on past correlations between prevailing prices in September and November.
As the above table shows, I'm projecting the price this November for a 20lb turkey to be $29.92, which is slightly less than last year but similar to 2014 and 2015. By and large, one of the stories of turkey prices (and poultry more generally) is how stable prices have become over time. This can be seen more dramatically by comparing turkey prices with the prices of other meats.
My family isn't a big fan of turkey. We often opt for steak. The figure below shows past and projected November prices for turkey and beef steak (on a $/lb basis).
Prices for steak have increased more than a dollar per pound in both real and nominal terms over the past 20 years; however, turkey prices have hovered around $1.45/lb in real terms for the past two decades, which a slight up-tick in 2013. Projected prices for steak this November are within a nickle per pound of where they were in November 2016.
If you're considering whether to have turkey or steak, another interesting comparison is the ratio of beef steak prices to turkey prices. This ratio tells you how many pounds of turkey can be purchased for each pound of steak for the same budget.
In November 2015, one could purchase about 5.5lbs of turkey for each pound of beef steak for the same total cost. This year, I'm projecting that a consumer can only buy 4.88 lbs of turkey for each pound of beef steak. That is, steak is projected to be relatively less expensive than turkey was in 2015 (though slightly more expensive than last year in 2016).
Of course, a Thanksgiving meal consists of more than just turkey or beef. Thus, it might be useful to compare overall how expensive food is this November compared to non-food items. Using BLS data on price indices for food at home and non-food items, I calculated the change in cost of food at home relative to non-food over time.
Compared to the base year, which I set to 1998, November prices of food at home rose at a slower rate than November prices of non-food items (i.e., food at home became less expensive relative to non-food items). That pattern reversed course in 2008, when food prices began increasing at a faster rate than non-food prices.
In 2016, and I'm also projecting for 2017, food at home has again started becoming less expensive relative to non-food items. So, this Thanksgiving, be a good economist, buy fewer non-food items, and eat well!


