My team in the Center for Food Demand Analysis and Sustainability (CFDAS) at Purdue University has worked to create two new data dashboards showing consumer spending at restaurants and for food delivery. We partnered with the firm Facteus, which processes debit/credit card transactions, and we use their data to understand trends, geographic differences, and rankings of restaurant in terms of consumer spending.
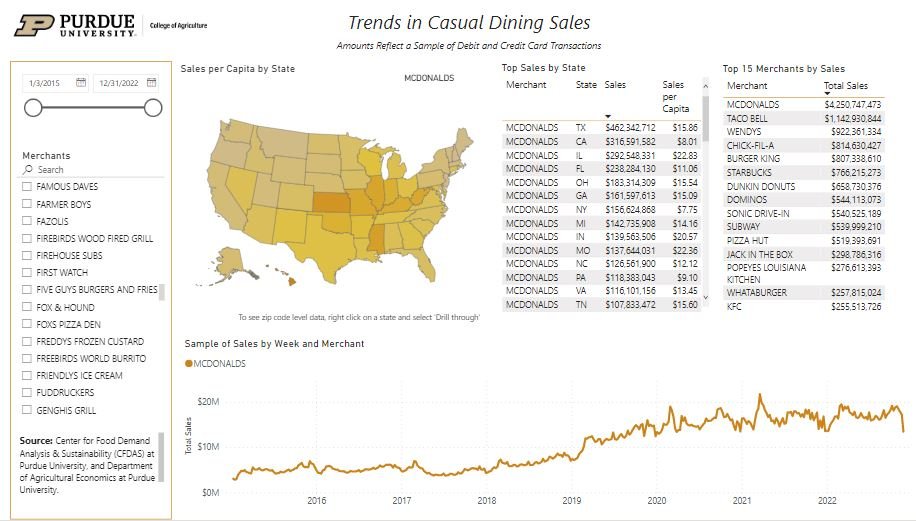
The first dashboard shows spending at restaurants, including fast food and casual dining (be patient: it might take a few seconds to load; the dataset is HUGE!). The figure below shows the dashboard set to McDonalds (the restaurant with the most sales). Apparently, Kansas is the state with the highest per-capita expenditures at McDonalds, although the highest McDonalds spending occurs in zip codes in Texas and California. The time trend shows McDonalds sales fared pretty well during the pandemic.
By contrast, if we look at a more traditional “sit down” restaurant like Applebee’s, the dip in sales during the pandemic is much more noticeable.

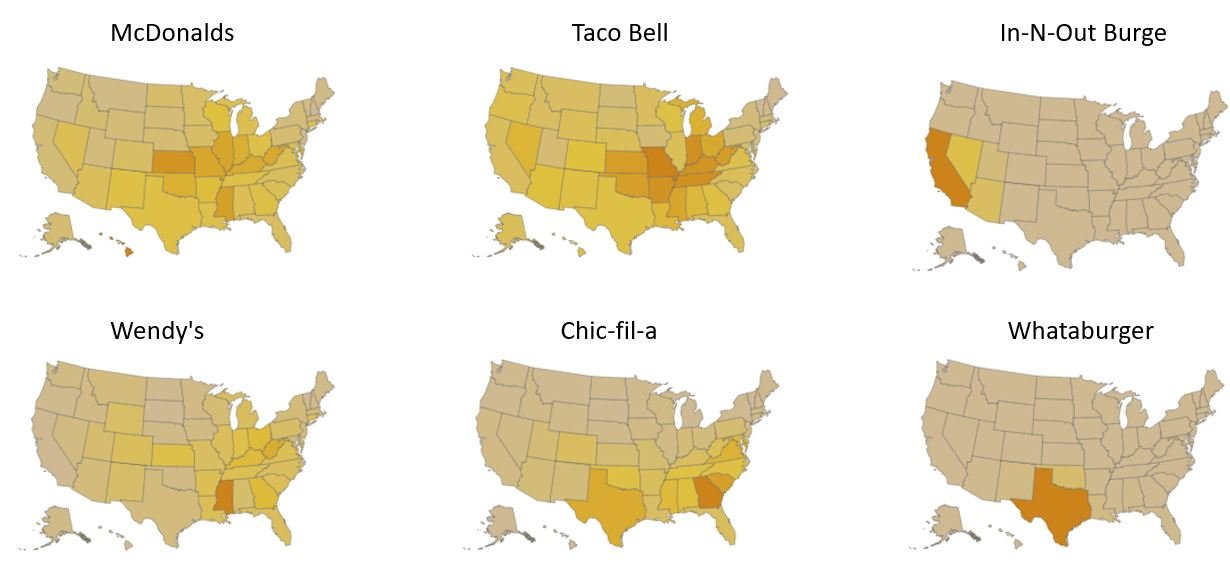
It is fun to look at geographic patterns in per-capita spending. For example, here are several top-selling fast food chains along with a couple regional favorites, including my personal favorite, Whataburger (yes, I am a Texas native).
You can even zoom in to the zip-code level if you want to see spending variation within a state. Have fun playing around with the dashboard yourself.
We have a second dashboard that looks similar except it shows spending patterns on meal delivery apps. Here is a screenshot of spending on Uber Eats, which clearly benefited by the pandemic.

We are looking forward to really digging into these data as we aim to better explore consumers food buying behavior in these food-away-from home markets.