Blog

Who are the vegetarians?

One of the challenges researchers face in trying to learn about the characteristics of vegetarians is that there are so few of them.  I've seen estimates that put the percentage of vegetarians in the US population as high as 13%, but most estimates are closer to 5%.  That means that if one does a survey that has 1,000 respondents (which is a pretty typical sample size for pollsters), you'll only have about 50 vegetarians in the sample - hardly a large enough sample size to say anything meaningful.

We've been running the Food Demand Survey (FooDS) for 19 months now, and each monthly survey has over 1,000 respondents.  I took the first years' data (from July 2013 to July 2015), which consists of responses from over 12,000 individuals.  This sample is potentially large enough to begin to make some more comprehensive statements about how vegetarians might differ from meat eaters in the US.

Applying weights to the sample that force the sample to match the population in terms of age, gender, region of residence, etc., we find that 4.2% of respondents say "yes" to the following question: "Are you a vegetarian or a vegan?", which means that 95.8% say "no".  

There is some sampling variability from month-to-month, but overall, the trend in the percentage of respondents declaring vegetarian/vegan status has remained relatively constant, and if anything, has trended slightly downward over time.

So, how do self-declared vegetarians/vegans differ from meat eaters?  The following table shows differences/similarities in socio-economic and demographic characteristics.

Some of the biggest differences appear for age, race, overweight status, and politics.  Vegetarians tend to be younger, less white, skinnier, and more liberal than meat eaters.  Two unexpected results are that vegetarians indicate a much higher rate of food stamp participation (which is a bit surprising since the share of households with >$100K in income is higher for vegetarians than meat eaters) and a much, much higher rate of food-borne illness.  

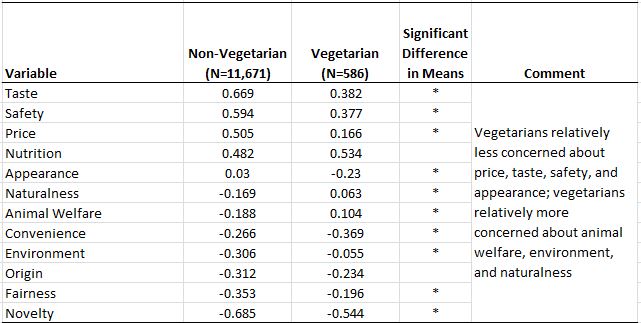
In our survey, we also measure respondents' "food values" (for detail on the approach, see this academic paper we published).  This approach requires people to make trade-offs (they cannot say all issues are most important).  Respondents are shown a set of 12 issues and are asked to place 4 (and only 4) of them in a box indicating they are the most important issues when buying food, and to also place 4 (and only 4) issues in a box indicating they are the least important issues when buying food.  We measure relative importance by subtracting the share of times an item appears in the least important box from the share of times it appears in the most important box.  Thus, relative importance is on a scale of +1 to -1, and average scores across all 12 items must to sum to zero.  

Meat eaters tend to rate taste and price as relatively more important food values than vegetarians.  Vegetarians tend to rate animal welfare and the environment as more important food values than meat eaters.  Even still, vegetarians rate nutrition, taste, price, and safety as more important food values than animal welfare or the environment.  

The survey also shows people a list of 16 issues and respondents indicate how concerned they are about each issue (1=very unconcerned to 5=very concerned).  As the table below shows, vegetarians are more concerned about all issues than are meat eaters, even an issue like GMOs which is (at present) primarily a plant issue.  The difference in level of concern between vegetarians and meat eaters is particularly large for gestation crates, battery cages, and farm animal welfare.  

Given some previous discussion on the economics of Meatless Monday, I ran some statistical models to determine whether vegetarians tend to spend more or less on food than meat eaters.  

Without controlling for any differences in income, age, etc. that were found in the initial table above, I do not find any statistically significant differences in spending patterns.  Meat eaters report spending about $94/week on food eaten at home and vegetarians report spending about $3 less (a difference that isn't statistically significant); meat eaters report spending about $46/week on food eaten away from home (e.g., at restaurants) and vegetarians spend about $9.80 more (a difference that isn't statistically significant).  Even after I control for differences in income, age, etc., I do not find any significant differences in food expenditures between vegetarians and meat eaters.  The biggest determinants of food spending is income (high income individuals (>$100K in income) spend $35/week more away from home than low income (<$40K in income)) and household size (larger households spend more).  Younger people spend about the same as the older on food a home, but spend more eating out than do the old.  

A short lesson on experimental auctions

One of the most robust findings from the research on what consumers are willing to pay for non-market goods (for example, foods made with new technologies that are not yet on the market) is that people tell researchers they are willing to pay more than they actually will when money is actually on the line.  One review showed, for example, that people tend to overstate how much they are willing to pay in hypothetical settings by a factor of about three.  That means if someone tells you on a survey that they're willing to pay $15, then they'd probably only actually pay about $5.

One way to deal with this problem of hypothetical bias is to construct experimental markets where real money and real products are exchanged.  The key is to use market institutions that give consumers an incentive to truthfully reveal their values' for the good up for sale.  I wrote a whole book with Jason Shogren on the subject of using experimental auctions for this purpose a few years back.

I recently filmed a short primer on the consumer research method for an on-line course being created by my colleague Bailey Norwood.  He graciously put it up online for anyone's viewing pleasure.  

What drives ingredient-based food fears?

That was the question asked in this article just published in the journal Food Quality and Preference.  The authors, Brian Wansink, Aner Tal, and Adam Brumberg surveyed over 1,000 mothers to study which food ingredients they found fearful, and they consider how such fears can be alleviated.  

The abstract:

This study investigates food fears that are ingredient-based, focusing on the case of high-fructose corn syrup. The results of a national phone survey of 1008 U.S. mothers offer five preliminary sets of observations: first, consumers with a fear of a specific ingredient – such as high-fructose corn syrup – may exaggerate and overweigh perceived risks. Second, such consumers may often receive more information from the internet than from television. Third, they may be partly influenced by their reference group. Fourth, ingredients associated with less healthy foods mainly hurt evaluation of foods perceived as relatively healthy. Fifth, food fears may be offset when an ingredient’s history, background, and general usage are effectively communicated. These findings suggest new insights for understanding how public health, industry, and consumer groups can more effectively target and address ingredient fears.

From the conclusions:

When health risks exist, food fears are merited. In other cases, ingredient fears and avoidance may be wrongly based on the stigmatization of an ingredient or on misinformation. These results offer new preliminary insights about who is most prone to ingredient avoidance, where they receive their information, what types of ingredients are most susceptible to being feared, and how fears might be mitigated.

There appear to be at least two non-mutually exclusive motivating factors behind ingredient avoidance. First, some individuals may overweigh the perceived risks of the avoided ingredient. Second, some individuals who avoid ingredients may have a greater need for social approval among their reference group than those with a more moderate view (though such effects were small in our sample). This is a key contribution to the literature on risk because it underscores a novel potential motivation – akin to the Prius Effect – behind ingredient avoidance.

Hypothetical bias - Catcher in the Rye edition

Economists tend to be skeptical of the answers people give on surveys - of people's stated preferences.  It's what we do that drives economic outcomes and well-being.  The trouble is that what we say on surveys often diverges from what we do when shopping.  The standard research finding is that, on average, people say on surveys that they are willing to pay about 2.5 times what they will actually pay when real money is on the line - a phenomenon referred to as hypothetical bias.  I've spent a lot of my career trying to devise survey techniques that get closer to the truth and I think we've made progress, but caution is warranted.

A lot of the research on hypothetical bias started in the 1980s and 90s when survey techniques started being more widely used to ask people to state their willingness-to-pay for environmental amenities.  Thus, you can might imagine my surprise when, recently re-reading Catcher in the Rye (published in 1951) the last chapter contained this clear, concise insight on hypothetical bias. 

A lot of people, especially this one psychoanalyst guy they have here, keeps asking me if I'm going to apply myself when I go back to school next September. It's such a stupid question, in my opinion. I mean how do you know what you're going to do till you do it? The answer is, you don't. I think I am, but how do I know? I swear it's a stupid question.

Does information on relative risks change concerns about growth hormones?

Consumers often express concern about the use of growth promotants in animal agriculture.  In the beef industry, various growth hormones are administered to cattle to improve and speed the rate of growth (and some would say, improve the sustainability of beef production).  Upwards of 90% or more of feedlot cattle in large feedyards are given hormone implants.

Some consumers are fearful about the safety effects.   For example, the EU has banned imports of hormone-treated cattle from the US for over 20 years (a policy which probably has more to do with protectionism than actual safety concerns).  Other people have argued that these are the cause of decreasing puberty age of girls (which the data doesn't support).

As a result, many in the beef industry have have tried to communicate the fact that the risks from hormones are small to non-existent, and are much smaller than the risks from hormones in everyday foods.  The normal comparison is between how much estrogen is in a hamburger from an implanted steer or heifer vs. the amount of estrogen in other foods like soybean oil or cabbage.  Examples of such discussions appear at BeefMyths.orgUS Meat Export Federation, the NCBA, and extension facts sheets from Michigan State University, University of Nebraska, University of Georgia, and many others.

Circulating on the web a while back were some discussions of using some visual strategies to communicate the relative risks from estrogen used in cattle implants.  For example, here is one blog discussing the use of M&Ms to convey the risks.  

The question I wanted to know is whether any of these sorts of communications actually has any impact on the people for whom it is intended.  

In the most recent issue of my monthly Food Demand Survey (FooDS), we sought to address this issue.  1,017 respondents were randomly allocated to one of three information groups or treatments.  In the first no-info group, respondents were simply told, “About 90% of feedlot cattle are given added growth hormones to improve the rate of growth.” And then, respondents were asked, “How concerned are you about the use of growth hormones in beef production?”  

For the second group text-only group, written text was added to convey relative risks of hormone use.  Prior to being asked level of concern, subjects were told, “About 90% of feedlot cattle are given added growth hormones to improve the rate of growth.  The added hormones add about 3 extra nanograms (a billionth of a gram) to a 3 oz serving of beef.  For comparison purposes, the amount of estrogen that naturally occurs in 3 oz of the following foods is: potatoes (225 nanograms), peas (340 nanograms), cabbage (2,000 nanograms), soybean oil (170,000 nanograms).”  

Finally, the third visual+text group was given the same written text but was also shown the above visual illustration using M&Ms allocated to different jars.  

Participants in all three groups answered with their level of concern on a five-point scale (1 = very unconcerned; 5=very concerned).

Information on relative risks caused a small but statistically significant reduction in the level of concern.  The mean levels of concern, on the 5-point scale, were 3.93, 3.71, and 3.66 for the no-info, text-only, and text+visual information groups.  

Without any information on relative risks, over 71% of respondents indicated that they were either concerned or very concerned.  Textual information reduced that frequency to 66%, and visual+text information further reduced the percentage of concerned respondents to 63.6%.