That’s the title of a new paper I’ve co-authored with Amelia Ales and Vincenzina Caputo that has been accepted for publication in the Journal of the Agricultural and Applied Economics Association.
It has long been conjectured in economics that goods that are more similar will be stronger substitutes, but there is surprisingly scant evidence for this assertion.
To explore this issue, we turn to a research method called “pile sorting.” Pile sorting, also known as card sorting, is a method long used in qualitative social sciences, but it is largely unknown or unused by economists. The method, in use for over 50 years, entails asking people to sort items or concepts into piles or groups according to their similarities or dissimilarities. Responses are used to identify the structure of the cognitive relationships between items through cluster analysis and multidimensional scaling.
In this new paper, we explore whether perceptions of similarity or dissimilarity can help explain why consumers treat products as utility substitutes or complements. We also introduce an approach to modeling pile-sorting data that avoids downsides of common analytic techniques used in previous work.
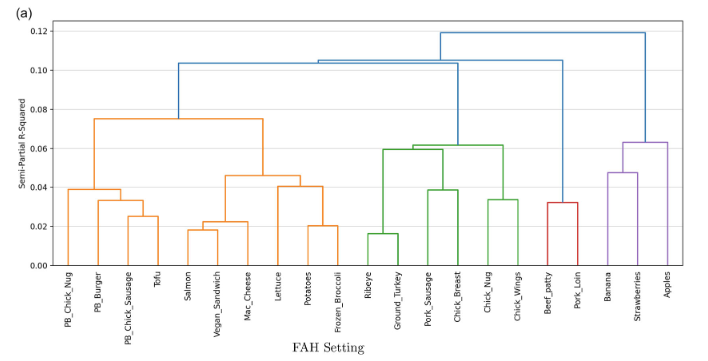
Here’s a figure showing the analysis of the pile sort data for foods purchased in a grocery setting. People tend to rate the plant-based (PB) meats as similar to each other and very different from bananas, strawberries and apples.
Are products perceived as more similar stronger demand substitutes? No, not necessarily. In fact, in a grocery setting, foods that are perceived as more similar are more likely to be demand complements (i.e., purchased together)
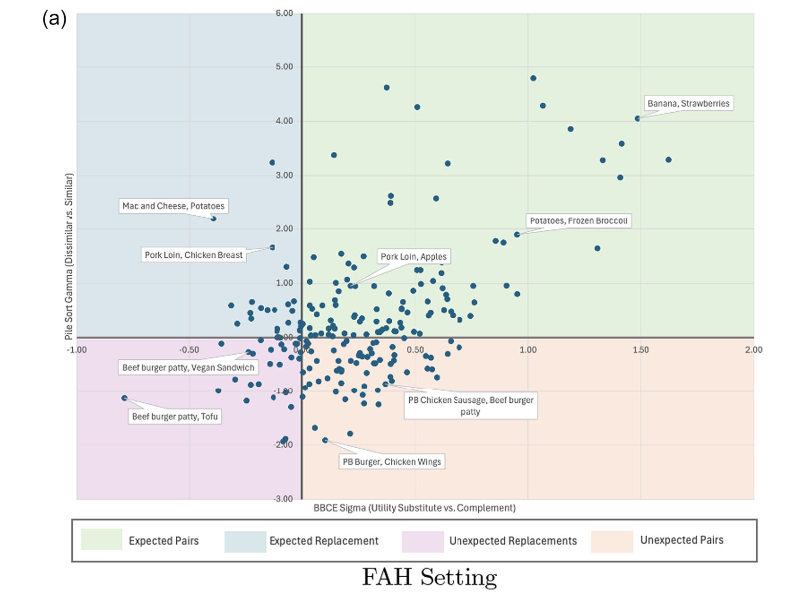
We find the opposite in a restaurant setting.
There’s a lot more in the paper including a discussion of implications for food marketing.
