Blog

Economics of Food Waste

There seems to be a lot of angst these days about food waste.  Last month, National Geographic focused a whole issue on the topic.  While there has been a fair amount of academic research on the topic, there has been comparatively little on the economics of food waste.  Brenna Ellison from the University of Illinois and I just finished up a new paper to help fill that void.

Here's the core motivation.

Despite growing concern about food waste, there is no consensus on the causes of the phenomenon or solutions to reduce waste. In fact, many analyses of food waste seem to conceptualize food waste as a mistake or inefficiency, and in some popular writing a sinful behavior, rather than an economic phenomenon that arises from preferences, incentives, and constraints. In reality consumers and producers have time and other resource constraints which implies that it simply will not be worth it to rescue ever last morsel of food in every instance, nor should it be expected that consumers with different opportunity costs of time or risk preferences will arrive at the same decisions on whether to discard food

So, what do we do?

First, we create a conceptual model based on Becker's model of household production to show that waste is indeed "rational" and responds to various economic incentives like time constraints, wages, and prices.  

We use some of these insights to design a couple empirical studies.  One problem is that it is really tough to measure waste.  And, people aren't likely to be very accurate at telling you, on a survey, how much food they waste.  Thus, we got a bit creative and came up with a couple vignette designs that focused on very specific situations.  

In the first study, respondents were shown the following verbiage.  The variables that were experimentally varied across people are in brackets (each person only saw one version).  

Imagine this evening you go to the refrigerator to pour a glass of milk. While taking out the carton of milk, which is [one quarter; three quarters] full, you notice that it is one day past the expiration date. You open the carton and the milk smells [fine; slightly sour]. [There is another unopened carton of milk in your refrigerator that has not expired; no statement about replacement]. Assuming the price of a half-gallon carton of milk at stores in your area is [$2.50; $5.00], what would you do?

More than 1,000 people responded to versions of this question with either "pour the expired milk down the drain" or "go ahead and drink the expired milk."  

Overall, depending on the vignette seen, the percentage of people throwing milk down the drain ranged from 41% to 86%.

Here are how the decision to waste varied with changes in the vignette variables.

The only change that had much impact on food waste was food safety concern.  The percentage of people who said they'd discard the milk fell by 38.5 percentage points, on average, when the milk smelled fine vs. sour.  The paper also reports how these results vary across people with different demographics like age income, etc.

We conducted a separate study (with another 1,000 people) where we changed the context from milk to a meal left-over.  Each person was randomly assigned to a group (or vignette), where they saw the following (experimentally manipulated variables are in brackets).

Imagine you just finished eating dinner [at home; out at a restaurant]. The meal cost about [$8; $25] per person. You’re full, but there is still food left on the table – enough for [a whole; half a] lunch tomorrow. Assuming you [don’t; already] have meals planned for lunch and dinner tomorrow, what would you do?

People had two response options: “Throw away the remaining dinner” or “Save the leftovers to eat tomorrow”.

Across all the vignettes, the percent throwing away the remaining dinner ranged from 7.1% to 19.5%.  

Here are how the results varied with changes in the experimental variables.

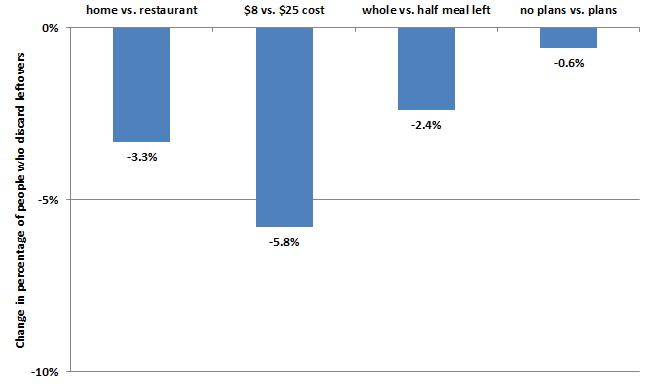
Meal cost had the biggest effect.  Eating a meal that cost $25/person instead of one that cost only $8/person reduced the percentage of people discarding the meal by an average of 5.8 percentage points.  People were also less likely to throw away home cooked meals than restaurant meals.  

There's a lot more in the paper if you're interested.

Where do we like to shop?

I thoroughly enjoyed reading this paper by Rebecca Taylor and Sofia Villas-Boas, which was just published in the American Journal of Agricultural Economics.  The research makes use of a new data set - the National Household Food Acquisition and Purchase Survey (FoodAPS) - initiated by the USDA to study where people of different income levels prefer to shop for food.  This question is relevant to the debate on so-called food deserts.  Are poorer households eating less healthily because of the lack of "good" food outlets in their area, or are there no "good" food outlets in an area because people there don't want that kind of food?  To sort this out, you need to know where people of different incomes prefer to shop, and that's precisely what Taylor and Villas-Boas estimate.

Their data suggest that, if anything, lower income households tend to have more stores near them, and at least one store closer to them, than higher income households.  For example, in a 1 mile radius, low income households have, on average, 1 superstore near them, whereas higher income households have, on average, only 0.58.  Using the USDA's definition of a food desert, the authors calculate that only 5%, 8%, and 3% of low, medium, and high income households live in a so-called food desert.  Whereas low income households live, on average, closer to the nearest farmers market than high income households (10.7 miles vs 11.93 miles), high income households are more likely to actually visit a farmers market.  

The authors go on to estimate a consumer demand model.  Where do consumers prefer to shop given the distances they have to travel?  When economists say "prefer" - they don't mean how one feels about a location or the images it conjures up, but rather what is actually chosen.  The authors find that people prefer going to locations that are closer to home.  That is, people don't like to travel too far to shop.  This estimate, then, lets them calculate how far one is willing to travel to shop at one type of store vs. another.  The authors consider 9 types of stores (including restaurants and fast food outlets), and find farmers markets are the least preferable shopping outlet in that people are willing to travel the least distance to get to a farmers market.  

Using the authors estimates, I calculated how much people would be willing to pay ($/week) to shop at each of the 8 other types of food outlets instead of the (least preferable) farmers market.

Both low and high income households would be willing to pay around $25/week to shop at a superstore instead of a farmer's market.  The data also suggests that higher income households prefer farmers markets more than do lower income households.  Across all the outlet types, low income household are willing to pay $18.67 to shops somewhere other than a farmers market, but for higher income households, the figure is only $13.95.  The figure also shows that higher income households are more willing to pay to eat at restaurants than are low income households.  This suggests that farmers markets and restaurants are normal goods - the more income you get the more you want to shop in these kinds of outlets. 

The authors write in the conclusions:

the households in this sample have low WTP for Farmers Markets to be closer to home, and high WTP to pay for Fast Food to be closer to home. This implies that simply building Farmers Markets will not induce households to shop there.

The authors interpret this finding to mean, "low-income households may need to be compensated to shop at Farmers Markets."  But, why?  Why would we use tax payer dollars to encourage shopping in food outlets people least prefer?  Perhaps some would say that farmers market sell healthier food.  Maybe, but the highly desirable superstores sell healthy food too.  And, if the problem is healthy eating, where is the market failure, and why would farmers markets be the most efficient solution to solve that failure?  

In any event, I look forward to seeing the authors' follow up work on the subject, which they discuss at the end of this paper.  

NYT Editorial on My Food Policy Study

Yesterday, the New York Times ran an editorial on the political fight over GMO labeling.  In the piece, the editorial board cited one of my studies (with Marco Costanigro) in the following passage:

There is no harm in providing consumers more information about their food. A study published in the journal Food Policy in 2014 found that labels about genetic modification did not influence what people thought about those foods.

I want to add a clarification and caveat to that statement.   What we found (in the context of an internet survey), is that the addition of GMO labels didn't make people more concerned about GMOs than they already were.  That is, the addition of a label didn't seem to send a signal that GMOs were more risky than consumers already thought they were.  

However, we did find that consumers would attempt to avoid foods with a GMO label.  Consumers' choices in our studied implied they were willing to pay as much $1.98/lb to avoid an apple that has a mandatory "genetically engineered" label relative to an unlabeled apple.  As I discussed just yesterday, it is precisely this issue that is the big potential driver of the costs of mandatory labeling.  That is, if some segment of consumers tries to avoid GMO labels, retailers and food manufacturers may respond by trying to source more costly non-GMO crops.    

Finally, I'll note that despite the above quote, that different types of GE labels in fact had very big effects on what people "thought" or were willing to pay for GE foods.  In particular, we compared how willingness-to-pay (WTP) for an unlabeled apple varied when there were apples with mandatory labels (i.e., "genetically engineered) vs.  voluntary labels (i.e., "not genetically engineered").

We found that the WTP premium for the unlabeled apple relative to the apple labeled "genetically engineered" was the aforementioned $1.98/lb.  However, the WTP premium for apples labeled "not genetically engineered" relative to the unlabeled apple was only $0.81/lb.  Thus, the implied willingness-to-pay to avoid GE was [(1.98–0.81)/0.81] ∗ 100 = 144% higher in the mandatory labeling treatment as compared to the voluntary labeling treatment.  In the paper, we write:

The differences in responses to mandatory vs. voluntary labels may result from the asymmetric negativity effect, which may in turn result from differences in what these two labels signal about the relative desirability of the unlabeled product. The differences in the “contains” vs. “does not contain” may also send different signals and change beliefs about the likelihood that the unlabeled product is GE or non-GE.

One more point that I just can't led slide.  The editorial also mentions the following:

Various polls have found that about 90 percent of Americans favor mandatory labels for genetically modified foods.

Yes, but about the same percentage of consumers say they want mandatory labels on foods with DNA.  And, when you directly ask people, the vast majority say they don't want the issue decided by state ballot initiatives but rather by the FDA.  And, we've had real-life ballot initiatives in five states now, and all have failed to garner more than 50% support.  Whatever positive reasons may exist for mandatory labeling, the cited "90% of people want it" reason is the most dubious and misleading.

Consumer Uncertainty about GMOs and Climate Change

A lot of the debate and discussion surrounding public policies toward controversial food and agricultural issues like GMOs or climate change revolves around public sentiment.  We ask people survey questions like "Do you support mandatory labeling of GMOs?"  However, as I've pointed out, consumers may not even want to have to make this sort of decision; they would prefer to defer to experts.  Thus, we're presuming a level of understanding and interest that consumers may not actually have.  This is related to the recent discussion started by Tamar Haspel in the Washington Post about whether the so-called food movement is large or small.  Are "regular" people actually paying much attention to this food stuff that occupies the attention of so many journalists, researchers, writers, and non-profits?

I had these thoughts in mind as I went back and looked at this post by Dan Kahan who took issue with Pew's survey on public opinions about GMOs (this was the survey that attracted a lot of attention because it showed a large gap in public and scientific opinion on GMOs).  Kahan wrote:

the misimpression that GM foods are a matter of general public concern exists mainly among people who inhabit these domains, & is fueled both by the vulnerability of those inside them to generalize inappropriately from their own limited experience and by the echo-chamber quality of these enclaves of thought.

and

That people are answering questions in a manner that doesn’t correspond to reality shows that the survey questions themselves are invalid. They are not measuring what people in the world think—b/c people in the world (i.e., United States) aren’t thinking anything at all about GM foods; they are just eating them.

The only things the questions are measuring—the only thing they are modeling—is how people react to being asked questions they don’t understand.

This let me to think: what if we asked people whether they even wanted to express an opinion about GMOs?  So, in the latest issue of my Food Demand Survey (FooDS) that went out last week, I did just that.  I took my sample of over 1,000 respondents and split them in half.  For half of the sample, I first asked, "Do you have an opinion about the safety of eating genetically modified food?"  Then, only for people who said "yes", I posed the following: "Do you think it is generally safe or unsafe to eat genetically modified foods?" For the other half of the sample, I just asked the latter question about safety beliefs and added the option of "I don't know".  This question, by the way, is the same one Pew asked in their survey, and they didn't even offer a "don't know" option - it had to be volunteered by the respondent.  So, what happens when you allow for "I don't know" in these three different ways? 

When "don't know" is asked 1st in sequence before the safety question, a whopping 43% say they don't have an opinion!  By contrast, only 28% say "don't know" when it is offered simultaneously with the safety question.  And, as the bottom pie graph shows, only about 6% of respondents in the Pew survey voluntarily offer "don't know".  Thus, I think Kahan's critique has a lot of merit: a large fraction of consumers gave an opinion in the Pew survey, when in fact, they probably didn't have one when this option was allowed in a more explicitly matter.  

Moreover, allowing (or not allowing) for "don't know" in these different ways generates very different conclusions about consumers' beliefs about the safety of GMOs.  Conditional on having an opinion, the percent saying "generally safe" varies from 40% in the sequential question to 50% in the simultaneous question to 39% in the Pew format which didn't offer "don't know."  That support can vary so widely depending on how "don't know" is asked is hardly indicative of stable, firm, beliefs about GMOs among the general public. 

In last week's survey I also carried out the same exercise regarding Pew's questions on climate change.  For half of my sample, I first asked whether people had an opinion about the causes of changes in the earth's temperature; for the other half, I included "don't know" as an option simultaneous with the question itself.   Here are the results compared to Pew's, which again did not explicitly offer a "don't know."  

Again, we see big differences in the extent to which "don't know" is expressed depending on question format, varying from 37% in the sequential version to only 2% in Pew's survey.  In this case, it appears that people who would have said "don't know" in the sequential question format are more likely to pick response categories that disagree with scientists, when they are given questions where "don't know" isn't so explicitly allowed.  

What can we learn from all this?  Just because people express an opinion on surveys doesn't mean they actually have one (or at least not a very firmly held one).  

Do Survey Respondents Pay Attention?

Imagine taking a survey that had the following question. How would you answer?

If you answered anything but "None of the Above", I caught you in a trap.  You were being inattentive.  If you read the question carefully, the text explicitly asks the respondent to check "None of the Above."  

Does it matter whether survey-takers are inattentive?  First, note surveys are used all the time to inform us on a wide variety of issues from who is most likely to be the next US president to whether people want mandatory GMO labels.  How reliable are these estimates if people aren't paying attention to the questions we're asking?  If people aren't paying attention, perhaps its no wonder they tell us things like that they want mandatory labels on food with DNA.

The survey-takers aren't necessarily to blame.  They're acting rationally.  They have an opportunity cost of time, and time spent taking a survey is time not making money or doing something else enjoyable (like reading this post!).  Particularly in online surveys, where people are paid when they complete the survey, the incentive is to finish - not necessarily to pay 100% attention to every question.

In a new working paper with Trey Malone, we sought to figure whether missing a "long" trap question like the one above or missing "short" trap questions influence the willingness-to-pay estimates we get from surveys.  Our longer traps "catch" a whopping 25%-37% of the respondents; shorter traps catch 5%-20% depending on whether they're in a list or in isolation.  In addition, Trey had the idea of going beyond the simple trap question and prompting people if they got it wrong.  If you've been caught in our trap, we'll let you out, and hopefully we'll find better survey responses.  

Here's the paper abstract.

This article uses “trap questions” to identify inattentive survey participants. In the context of a choice experiment, inattentiveness is shown to significantly influence willingness-to-pay estimates and error variance. In Study 1, we compare results from choice experiments for meat products including three different trap questions, and we find participants who miss trap questions have higher willingness-to-pay estimates and higher variance; we also find one trap question is much more likely to “catch” respondents than another. Whereas other research concludes with a discussion of the consequences of participant inattention, in Study 2, we introduce a new method to help solve the inattentive problem. We provide feedback to respondents who miss trap questions before a choice experiment on beer choice. That is, we notify incorrect participants of their inattentive, incorrect answer and give them the opportunity to revise their response. We find that this notification significantly alters responses compared to a control group, and conclude that this simple approach can increase participant attention. Overall, this study highlights the problem of inattentiveness in surveys, and we show that a simple corrective has the potential to improve data quality.