Blog

Real World Demand Curves

On a recent flight, I listened to the latest Freakonomics podcast in which Stephen Dubner interviewed the University of Chicago economist Steven Levitt about some of his latest research.  The podcast is mainly about how Levitt creatively estimated demand for Uber and then used the demand estimates to calculate the benefits we consumers derive from the new ride sharing service.  

Levitt made some pretty strong statements at the beginning of the podcast that I just couldn't let slide.  He said the following:

And I looked around, and I realized that nobody ever had really actually estimated a demand curve. Obviously, we know what they are. We know how to put them on a board, but I literally could not find a good example where we could put it in a box in our textbook to say, “This is what a demand curve really looks like in the real world,” because someone went out and found it.

As someone whose spent the better part of his professional career estimating consumer demand curves, I was a bit surprised to hear Levitt claim "nobody ever had really estimated a demand curve."  He also said, "we completely and totally understand what a demand curve is, but we’ve never seen one."  The implication seems to be that Levitt is the first economist to produce a real world estimate of a demand curve.  That's sheer baloney.  

The most recent Nobel prize winner in economics, Angus Deaton, is perhaps most well known for his work on estimating consumer demand curves.

In fact, agricultural economists were among the first people to estimate real world demand curves (see this historical account I coauthored a few years ago).  Here is a screenshot of a figure out of a paper by Schultz in the Journal of Farm Economics in 1924 who estimated demand for beef.  Yes - in 1924!  I'm pretty sure that figure was hand drawn!

Or, here's Working in a paper in the Quarterly Journal of Economics in 1925 estimating demand for potatoes.

Two years later in 1927, Working's brother was perhaps the first to discuss "endogeneity" in demand (how do we know we're observing a demand curve and not a supply curve?), an insight that had a big influence on future empirical work.

Fast forward to today and there are literally thousands of studies that have estimated consumer demand curves.  The USDA ERS even has a database which, in their words,  "contains a collection of demand elasticities-expenditure, income, own price, and cross price-for a range of commodities and food products for over 100 countries."   

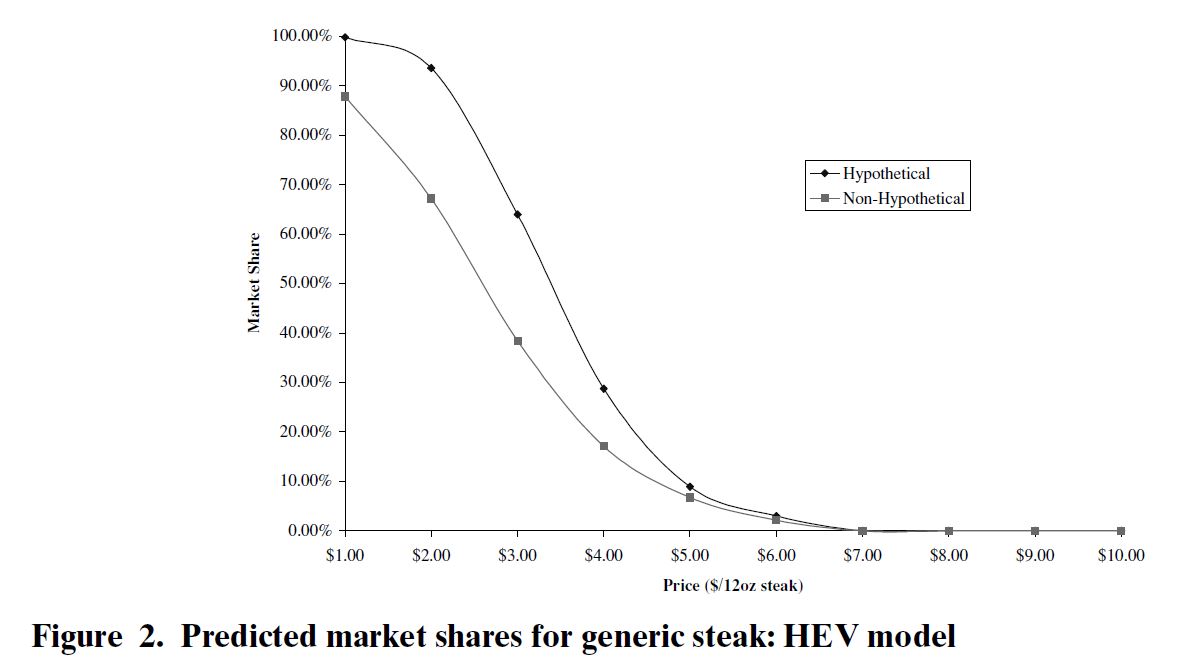
Here is a figure from one of my papers, where the demand curve is cleanly identified because we experimentally varied prices.  

And, of course, I've been doing a survey every month for over three years where we estimate demand curves for various food items.

In summary, I haven't the slightest idea what Levitt is talking about.  

Food Insecurity is Down

The USDA just released their annual accounting of food security in the United States.  Good news!  Food insecurity fell to 12.7% in 2015 (down from 14.9% in 2011).  Here's a key graph from the report.

One could quibble with the USDA's method of computing food security (it is based on  responses to a variety of survey questions), but whatever "flaws" are inherent in the USDA methods, as long as they have remained constant over time, the trends should be informative.  

Of interest is how food insecurity measures change with participation in SNAP (aka "food stamps).  Using USDA data on SNAP participation, I calculated per-capita participation which is shown in the following graph.  Though the pattern is somewhat similar (i.e., food insecurity and SNAP participation both rose after the Great Recession and then declined in 2015), it isn't a perfect corollary.  In particular, food insecurity is higher in 2015 than in was in 1995, but today there are more participants per capita on SNAP than there were in 1995.  

Another variable which might relate to food insecurity and SNAP participation is the price of food.  Here is a graph of Bureau of Labor Statistics data showing the price (or CPI) of food relative to the price (or CPI) of non-food items from 1995 to 2015.  

Over at the US Food Policy blog, Parke Wilde notes that even though food insecurity has fallen, it hasn't fallen nearly enough to keep up with food insecurity targets.  The above graphs suggest one potential reason why: food is relatively more expensive today than was the case 20 years ago.  Of course, the overall story is surely much more complicated than that.  

Optimal fat tax

In the Washington Post article Catherine Rampell raises an important point with regard to the emerging debate over whether to tax soda.  

Instead of arbitrarily singling out one category of bad foodstuff for taxation — and the categories of bad foodstuffs will always be somewhat arbitrary — a more effective route to reducing consumption of excessive sugar or calories might be a universal, graduated sugar or calorie tax.

But even that still doesn’t quite seem fair or, for that matter, efficient. After all, a calorie tax would also hit people who consume more calories because they are very active, such as marathoners. Besides being regressive, a tax on calories or sugar would also effectively, if unintentionally, make it more expensive for trim people to exercise.

In other words, a lot of inputs go into determining whether a person is obese. Taxing some of those inputs distorts the relative prices of those inputs, but it doesn’t necessarily change the desired output: obesity rates.

Which raises the question: Why not just target the output, rather than some random subset of inputs? We could tax obesity if we wanted to. Or if we want to seem less punitive, we could award tax credits to obese people who lose weight. A tax directly pegged to reduced obesity would certainly be a much more efficient way to achieve the stated policy goal of reducing obesity.

Yet, people don't seem to like the idea of a fat-person tax.  Why not?

Maybe it’s because they’re regressive (but so are soda taxes). Maybe it’s because it sounds like we’re shaming fat people (but arguably so does any policy aimed at reducing obesity). Maybe it just feels unfair to tax people based in any way on their genes, which, like diet and exercise, can also be a determinant of weight.

But if we assume it’s impossible for obese people to lose weight by any combination of inputs they do have control over, it’s hard to simultaneously argue that making one of those inputs more expensive could lead to some nationwide weight-loss miracle. Pop goes the pop-tax rationale.

Cost Effectiveness of Soda Taxes

In a piece for Cato, Christopher Snowden discusses the effectiveness (or lack thereof) of soda taxes that seem to be gaining traction worldwide.  Snowden's views closely mirror my own.  I like the way he framed the relative effectiveness of soda taxes in this passage:

Whilst the benefit remains forever on the horizon, the cost can be easily calculated; it is simply the amount of money squeezed from consumers by the tax. In New Zealand, for example, advocates claim that a 20 per cent tax on soda would save 67 lives per year and raise $40 million (NZ).[12] Leaving aside the reliability of the New Zealand forecast, this works out as a cost of $600,000 (NZ) for every life that is extended and does not represent good value for money.

Political action on public health grounds is often justified by the costs of unhealthy lifestyles to the healthcare system, and therefore to the taxpayer. The economic costs of obesity are often misrepresented and fail to account for savings to taxpayers, but even if they were more reliable it is far from obvious that additional taxes would relieve the economic burden.[13] For example, the UK’s Children’s Food Campaign recently claimed that a 20 per cent tax on sugary drinks would reduce healthcare costs in London by £39 million over twenty years, but their own figures suggest that the tax itself will relieve Londoners of £2.6 billion over the same period.[14] The cost of the tax will therefore exceed the savings by several orders of magnitude.

By the way, if you want to see which (out of more than 100) action will produce the biggest bank for your buck, check out the work of the Copenhagen Consensus, which routinely conducts cost-benefit analysis on a whole set of issues.  See their list for the most cost-effective actions.

How Fat Taxes Affect the Rich and the Poor

I'm pleased that the Economic Journal has decided to publish the paper Distributional Impacts of Fat Taxes and Thin Subsidies I wrote with  Laurent Muller, Anne Lacroix, and Bernard Ruffieux of the University of Grenoble and the French National Institute for Agricultural Research.  

Here is an excerpt

How do the price policies differentially affect women at different points in the income distribution? Beliefs about the relative effects of fat taxes and thin subsidies on the poor relative to the non-poor are often premised on two assumptions. First is the assumption that the poor consume less healthful diets than the non-poor, perhaps due to the higher costs of more healthy diets (e.g., Drewnowski and Specter, 2004). The second assumption is that price policies are more likely to benefit low income consumers because low income consumers have more room for improvement, and because of their financial situation, they are likely to be more responsive to price changes. In short, a common view is that price policies can help the poor “catch up” to the non-poor in terms of the healthfulness of their diets.

Our experimental results confirm the first assumption: poor women tended to purchase less healthy food than the non-poor women. The implication is that, holding initial consumption patterns constant, policies which tax unhealthy food and subsidise healthy food will be regressive, favouring the non-poor more than the poor. But, people can change consumption patterns in response to price policies. If the poor are more responsive to price policies than are the non-poor, then inequalities will be dampened. This hypothesis, however, was rejected. Behavioural adjustments to the price policies amplified rather than dampened the divergent fiscal impacts of the price policies.

In short:

The tax/subsidy policies serve to widen the gap between the poor and non-poor, increasing the inequality in health and fiscal outcomes. Fat taxes cause the poor to pay disproportionally more for food than the non-poor and thin subsidies primarily flow to the non-poor. These effects occur because the non-poor already consume healthier diets but also because the non-poor are more price responsive than the poor

Our approach to addressing this issue is quite different than that of previous studies.  Here's what's unique about our appoarch

The advantage of the experimental set-up is that people’s choice behaviours are directly observed (rather than inferred as in a simulation study). In addition, the setting does not require the use of econometric models to infer behavioural responses. There is no need to assume a functional form or structure for responses; each individual can respond in their own unique way according to their own preferences. The experiment attempts to measure the overall fiscal effect (based on a day’s food choices) rather than simply focusing on one or two foods or a few food product categories. The experiment environment also allows us to study larger price variations (+/- 30%) than would likely have been feasible outside the lab, and as such, makes the price changes particularly salient.

Here is one of the key figures from the paper.  The figure shows the distribution of price indices (i.e., the relative change in prices paid) after the introduction of a combined unhealthy-food-tax and healthy-food-subsidy policy for low income women as compared to a reference group (i.e, "normal" income women).

The Laspeyres index calculates the change in prices paid relative to the initial pattern of consumption; the Paasche index is similar except that it weights prices paid using the new pattern of consumption.  A greater difference between the two indices reveals greater substitution and responsiveness to the policy.

The figure above shows that 25-30% of  the low income consumers paid more for food after the price policy (they had an index greater than 100), and given the similarity of the two red lines, were less responsive (perhaps because of being more habit prone) than the richer consumers.  Moreover, at the individual level, the Paasche index was higher than the Laspeyres index for 35.9% of low income individuals.  These individuals did not shift their diet in the intended direction.

We ended the paper as follows:

Whatever health benefits these policies might create, this paper suggests they need to be weighed against the adverse monetary effects they have on some of the poorest people in society.