Blog

How Many Americans Go Hungry?

One of the most basic measures of well-being is whether people have enough food to eat. Whether the U.S. does well in this regard seems to depend on who you ask.  There are many people in the so-called food movement who seem to think we're doing ok on this front and that food is actually too cheap.  There are other groups like Feeding America that think hunger is a serious concern and are doing what they can to reduce it.

The USDA Economic Research Service produces the most widely used measure of hunger (or as they call it "food security").  According to their data

An estimated 12.7 percent of American households were food insecure at least some time during the year in 2015, meaning they lacked access to enough food for an active, healthy life for all household members. That is down from 14.0 percent in 2014.

This figure shot up during the great recession (reaching a high of 14.9% of households in 2011) but has subsequently fallen a bit as indicated above, but still remains higher than was the case prior to 2008 when it was regularly in the 10 to 11% range.  

I was curious how the sample of people I study every month in my Food Demand Survey (FooDS) matches up with these official government statistics.  In the most recent April 2017 edition of FooDS, we added some questions (the short 6-item measure) based on work by the USDA to measure food insecurity.  As an example, one of the questions is "'The food that I bought just didn’t last, and I didn’t have money to get more.' Was that often, sometimes, or never true for you/your household in the last 12 months?"

Data from FooDS reveals a strikingly high level of food insecurity - much higher than what the USDA reports.  According to the criteria outlined at the above link, we found a whopping 46.7% of respondents were classified as having low or very low food security (22.9% of the sample had low food security and 23.8% had very low food security).  

My first thought was that we must have made a mistake in how we asked the questions or in how we analyzed the data.  We ruled out those possibilities.  My second thought was that maybe my survey sample is really different from the U.S. population.  After all, who is willing to sign up to take online surveys?  Maybe people who really need the money and who are thus more likely to be food insecure.  But, this couldn't be the complete answer because I use weights to force my sample to match the U.S. population in terms of age, education, gender, and region of residence, and the average income of my sample isn't much different from the average income of the country as a whole.  Maybe the difference is that I used a 6-item measure of food insecurity rather than the full 18 items used by the USDA (but previous research has found strong agreement between the two).

When I mentioned this quandary to my friend Bailey Norwood, he knew immediately what was causing part of the the discrepancy, and I think it could have a big impact on how we fundamentally view the food security measures reported by the USDA.  

In short, the USDA assumes that if you make enough money you can't be food insecure [*Addendum, this original sentence, as stated, was too strong. As the quote below suggests, you can't be classified as food insecure if you're high income AND if you answer two preliminary questions on food insufficiency in particular way.  Some researchers in this area emailed me to note that about 25% of food insecure households have incomes at least 300% of the poverty line]. In their latest report, they indicate in footnote 5: 

To reduce the burden on higher income respondents, households with incomes above 185 percent of the Federal poverty line that give no indication of food-access problems on either of two preliminary screening questions are deemed to be food secure and are not asked the questions in the food security assessment series.

What if I take my FooDS data and just assume anyone that has an income that puts them at 185% of the poverty line (based on these criteria) is food secure despite the answers they gave on the survey? (note: my calculations are crude because I only measure household income in wide $20,000 ranges and I simply assign people to the midpoint of the income range they selected).   

When I do this, I find that now "only" 22% are classified as having low or very low food security (9% of the sample had low food security and 13% had very low food security).  That's still a lot higher than what the USDA reports, so maybe my internet survey still has some sample selection issues.  However, it's still HALF the original measure.

What does this mean?  There are a lot of relatively high income people that would be classified as food insecure if the USDA simply asked them the same questions as everyone else.  There are a lot of relatively high income people that say "yes" to questions like "In the last 12 months, did you ever eat less than you felt you should because there wasn't enough money for food?"  

None of this to say that income isn't a determinant of food security, but that it shouldn't be the only signal, particularly if someone is in a lot of debt or if they have large households, they could still be going hungry.

In any event, here are some of the demographic characteristics of the people who, according to my sample (and without making the above discussed income correction), classify as being food secure, low food security, or very low food security.  

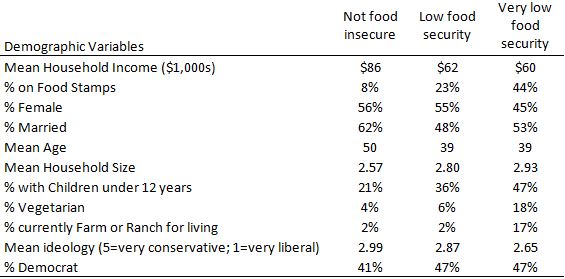
As the above table indicates, income matters as the average income of food secure households is $86,000/year.  However, households with low food security still average $60,000/year, which is far above 185% of the poverty level for most households.

Households that classify as very low food security are much more likely to be on SNAP (aka food stamps).  Of course, this isn't causal: being on SNAP isn't causing food insecurity but likely the other way around.  Two other noteworthy results.  Households classified as having very low food security are much more likely to 1) have children in the household and 2) report farming or ranching as a primary occupation.  

Why the rise in demand for chicken?

Last month I discussed the ways economists attempt to study changes in beef demand.   Over at meatingplace.com, Mack Graves delves into the issue and questions why chicken demand has risen at a faster pace over the past several decades compared to beef.  He writes.

A recent study of beef demand by Glynn Tonsor and Ted Schroeder of Kansas State University published on Feb. 3, 2017 showed beef demand rising from an index of 75 (1990 = 100) in 2010 to 93 in 2015. That’s a gain of 18 points in five years! However, the 75 index in 2010 was the lowest value in the 25 year period.

For some perspective, the chicken demand index rose from slightly more than 100 in January of 2011 to about 112 in October of 2016 although it had reached a high of 128 in late 2015.

Graves' diagnosis as to why chicken demand has fared better than beef demand?

Analyzing chicken’s success starts with one word—fat. There is no question that the science community with its study after study deploring the saturated fat in beef was a kick starter for chicken consumption. All the fast food chains jumped on this bandwagon led by McDonald’s with their chicken McNuggets.

I suspect he's partially right.  Fat concerns probably explain part of the decline in the 1980s and early 1990s.  But, there is another major part of the story: relative prices.  

If beef and chicken are demand substitutes, then a fall in the the price of chicken will cause people to substitute away from beef toward the lower priced chicken.  This will result in a fall in the beef demand index (or at least make the index smaller than it would have been otherwise). 

So, what's happened to the retail price of chicken compared to beef since the 1970's?  Here's the retail price of beef divided by the price of chicken according to USDA data.

In the early 1970's, a pound of beef was about 2.5 times more expensive than a pound of chicken, and this figure trended upward over time.  Today, beef is over 4 times more expensive than chicken.

The lesson here is that increased efficiency of chicken production, resulting in lower relative chicken prices, has led to an increase in chicken consumption and reduction in beef demand.     

How much will that organic, gluten free, vegetarian diet cost you?

I recently ran across this interesting website and online tool put out by the lender lendingtree.com.  According to their website:

The total cost of a grocery bill is majorly influenced by consumer shopping habits. According to the U.S. Department of Agriculture (USDA), the national average weekly grocery bill for individuals from ages 19 to 71 is $61.85. By referencing the USDA recommended balanced food plate to create a healthy grocery list and the national average for an individual food budget into consideration, we’ve uncovered how changing one’s diet to reflect a gluten free, organic, vegetarian or vegan diet can significantly affect the cost of their grocery bill.

Here is one of several graphics at the site.

On that note, I'll also link to a paper I recently published with Bailey Norwood where we compare the food expenditures of self-identified vegetarians and vegans to non-vegetarians.

What's Going on With Wheat Futures?

One of the primary ways farmers have to manage price risk is via the futures market.

Before getting to a potential problem that has emerged, I'll first provide a short primer for those unfamiliar with futures markets 

An Oklahoma or Kansas wheat farmer is likely to begin planting sometime in September or October, but when planting they don't yet know what the wheat price will be at harvest in June or July the next year.  So, to protect themselves against adverse price fluctuations, a farmer might turn to the Kansas City Hard Red Winter Wheat Futures Contract.  The CME Group has a futures contract that settles every year around harvest in July.  Right now, the July 2017 contract is priced at about $4.50/bushel.  

For simplicity sake, let's say a farmer faced the same July 2017 futures price back in September of 2016, and they wanted to protect the price associated with (i.e., hedge) 5,000 bushels of wheat (which is exactly the size of one futures contract).  In September 2016, the farmer would sell one July 2017 contract, receiving  5000*4.50=$22,500.  This action has now contractually obligated the farmer to deliver 5,000 bushels of wheat come July to "offset" their selling position [addendum: while other futures contracts work in this way, this isn't true for winter wheat; rather than delivering wheat, the farm has contracted to deliver a "registered electronic warehouse receipt"].  Normally, however, a farmer doesn't want to go through the hassle of actually having to deliver physical wheat to a delivery point, so they instead buy back (in this example) one futures contract to offset their position when June or July rolls around.  If the price of the July 2017 contract falls from September to July, the farmer makes money from the futures market (e.g., if the price falls to $4.00, the farmer has has to spend 5000*4=$20,000 to offset their original position of $22,500, making $2,500), which helps them offset the loss in expected wheat price they receive when they sell their wheat in the cash market.  Exactly the opposite happens if the price of the July 2017 contract increases - the farmer looses money from the futures market, but receives a higher than expected cash price.  This is why it is said that using the futures market "locks in" the price at the time of planting.  

Although most farmers never actually delivery their wheat to settle their futures contract, this threat of delivery is what ties the futures price to reality.  If, for example, a farmer notices that come July 2017, the July 2017 futures contract is trading at a price well above the cash price being paid for wheat "on the ground" in grain elevators, they have a strong incentive to offset their futures position by actual delivery rather than buying a futures contract.  These arbitrage opportunities are what should force the futures market price to eventually equal the cash market price when July 2017 rolls around.   

All of that is a lead in to this video put out by Art Barnaby at Kansas State University.  It seems that farmers, at least in some situations, are not actually able to deliver wheat to offset their futures positions.  Aside from fundamental concerns about what is being measured by futures market in this case, one farmer in the video says:

A lot of us were relying on that and felt very betrayed by the fact that what we understood to be a contract was not.

[Addendum Barnaby sent me a note of clarification.  The underlying issue here is that farmers have been generally taught and told that they can settle wheat contracts by the delivering physical commodity, when in fact the underlying contract says something different. He indicated: "Farmers are not obligated to deliver 5,000 bushels of wheat; they are obligated to deliver a registered electronic warehouse receipt issued by warehousemen against stocks in warehouses.  This is the reason farmers can’t deliver wheat on a short futures.  You will find this in the contract  . . .The market is trading the value of a CME approved warehouse receipt because that is the only thing that can be delivered."]  

Unanticipated Effects of Soda Tax, example 1037

On the surface the logic of a soda tax seems simple: raise the price of an unhealthy food, people consume less, and public health improves.  But, as I've pointed out again and again on this blog, the story is much less simple than it first appears.  

First, even if we believe people suffer from various behavioral biases, higher prices almost certainly make people worse off.  Second, when we raise the price of one unhealthy thing, people might substitute to consume other unhealthy things.  Third, if the tax is just added at the checkout counter and not on the shelf display, it may not have nearly the effect on purchase behavior as assumed.  Forth, if people know the reason for the tax, some may "protest" and buy more instead.  Fifth, the projected weight loss from such taxes often relies on unreasonable rules of thumb like 3500kcal=1lb. Six, even when taxes have an effect, the causal impact may arise more from an "information effect" rather than a "price effect."  Seventh, such taxes may induce unanticipated effects because of how sellers respond to the policy.  Finally, soda taxes are regressive - having a proportionally larger effect on on lower income households (see also my co-authored paper on effects of "unhealthy" food taxes more generally).

Now, comes this new paper in the American Journal of Agricultural Economics by Emily Wang, Christian Rojas, and Francesca Colantuoni, which incorporates the insight that some households are more likely to respond to promotions and to store.  The abstract:

We apply a dynamic estimation procedure to investigate the effect of obesity on the demand for soda. The dynamic model accounts for consumers’ storing behavior, and allows us to study soda consumers’ price sensitivity (how responsive consumers are to the overall price) and sale sensitivity (the fraction of consumers that store soda during temporary price reductions). By matching store-level purchase data to county-level data on obesity incidence, we find higher sale sensitivity in populations with higher obesity rates. Conversely, we find that storers are less price sensitive than non-storers, and that their price sensitivity decreases with the obesity rate. Our results suggest that policies aimed at increasing soda prices might be less effective than previously thought, especially in areas where consumers can counteract that price increase by stockpiling during sale periods; according to our results, this dampening effect would be more pronounced precisely in those areas with higher obesity rates.