Blog

Meat expenditure shares

It seems there is a constant barrage of studies, books, and media critical of animal agriculture. The negative publicity is multifaceted and ranges from concerns about animal welfare, health impacts, food safety, climate change, environmental impacts, water usage, food security, and on an on.  

Just to given one representative example, here is James McWilliams writing in the New York Times in a 2012 article entitled The Myth of Sustainable Meat:

 THE industrial production of animal products is nasty business. From mad cow, E. coli and salmonella to soil erosion, manure runoff and pink slime, factory farming is the epitome of a broken food system.

He argues there, and in a more recent 2014 editorial in the same outlet that we the best solution is to give up eating meat.  I used McWilliam as an example, but I could have picked any number of high profile books (e.g., here or here), academics, advocacy groups (e.g., here or here), or news stories that paint conventional animal production industries in a less than favorable light.

Here is my question: how much impact, if any, has this had on consumers' demand for meat, dairy, and eggs?  

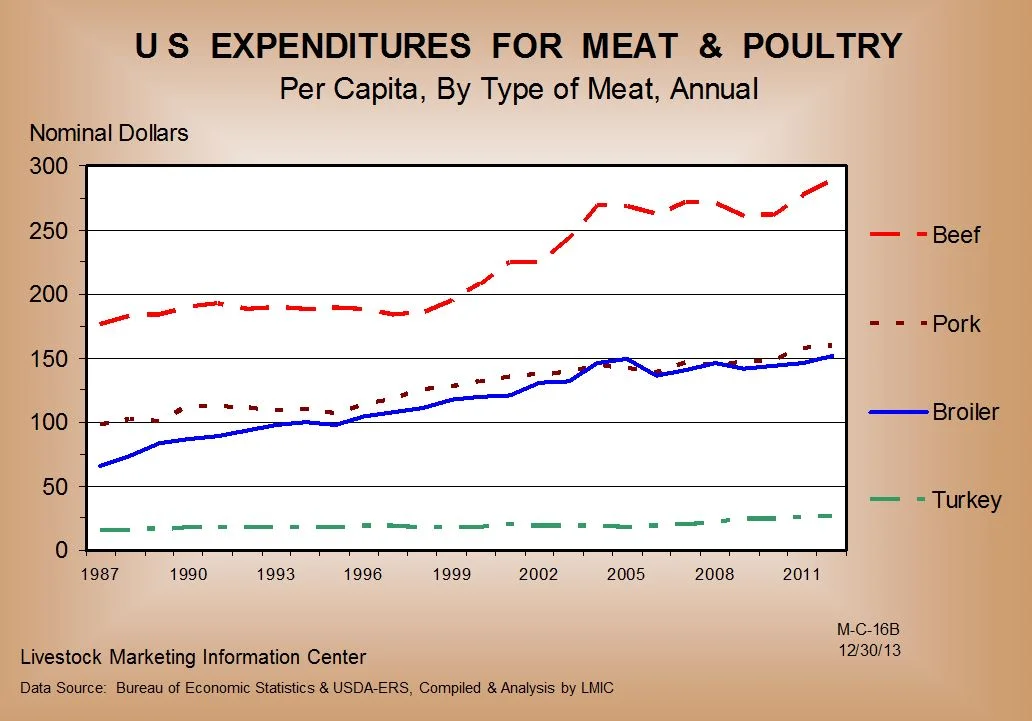
To indirectly get at this question, I turned to some data collected by the Bureau of Economic Analysis (BEA) on Personal Consumption Expenditures.  The BEA reports total expenditures on food at home in a variety of categories going back to 1959.  I took this data and calculated the share of total expenditures on food eaten at home (what the BEA calls " Food and beverages purchased for off-premises consumption") attributable to beef, pork, poultry, eggs, and dairy products.  For reference, total expenditures on food eaten at home was about $61.5 billion in 1959 (in 1959 dollars) and was about $884 billion in 2013 (in 2013 dollars).  

There was a remarkable downward trend in the allocation of consumers' food budget away from dairy and beef from 1959 till the early 1990s, and an uptick in poultry.  Consumers went from spending about 12-14% of their food budget on beef and another 12-14% on dairy in the early 1960s down to about 5-8% on each in the early 1990s.  Stated differently, consumers just about halved the proportion of their food budget going toward beef and dairy in a 30 year time period.  

There were a lot of reasons for these changes.  These industries became much more productive and prices fell, so consumers could allocate less of their budget to these items but still consume the same amount or more.  The price of poultry fell much more rapidly than the price of beef, and thus some of the downward trend reflects substitution away from beef toward poultry.  There were other consumer concerns during that period related to cholesterol, saturated fat, E coli, etc. that led to less consumption of beef and dairy.  

Despite, all that, it is remarkable how resilient meat demand has been over the last 20 years in light of the large amount of negative publicity mentioned earlier.  To illustrate, here is the graph  just from 1993 to 2013.

The lines are essentially flat.  People are allocating just about the same amount of their food budget to beef, pork, dairy, poultry, and eggs today as they did 20 years ago.  

It may be the case that all the aforementioned negative publicity in recent years will eventually cause consumers to allocate their food budget away from animal products.  But, at least so far, it doesn't seem to have had much of an impact.

Why are beef prices so high?

If you've been down the meat aisle in the grocery store recently, you might have noticed that beef is getting pricey.  Indeed, cattle prices have recently been near historically high levels in recent months.  For some perspective, here are inflation-adjusted retail meat prices since January 2000 (these are monthly USDA data compiled by the Livestock Marketing Information Center and the USDA-ERS; final data point is January, 2014).  

As you can see, real beef and pork prices are higher now than they've been in at least 15 years (and that means they're substantially higher in nominal terms).

As the graph reveals, starting in about 2010, beef and pork prices began to rise, although the rate of increase has been faster for beef than for pork.  Over the same time period, chicken prices have remained relatively constant, and are actually slightly lower in real terms today than in the early 2000s.  

The graph above masks what has been happening in the last few weeks and months.  On that issue, here is a graph from the Livestock Marketing Information Center showing wholesale boneless beef prices (fresh, 90% lean - mainly used in ground beef) in recent weeks.  As you can see, 2013 prices were above the 2008-2012 average, and 2014 prices are much higher still.

What is happening that has caused the run-up in beef prices?  

The answer to that question is a dissertation topic unto itself, but here are a few rough thoughts:

  • I don't think the answer is primarily on the demand side.  Despite all the negative publicity for meat products (from media coverage of food safety, animal welfare, global warming, health, water use, etc. etc.), estimates from our Food Demand Survey and from the demand indices compiled by Glynn Tonsor at Kansas State suggests relatively stable to slightly increasing demand.  Higher demand will tend to pull up prices, but I don't think the demand changes are anywhere near large enough to explain the price rises.
    • Increased demand for meat products from other countries might tell part of the story, and although there has been a general rise in beef exports in recent years, it also doesn't seem big enough to explain the trend.
  • That leaves supply-side issues.  Cattle inventories are at their lowest level since the 1950s. Because of technological advancement, we don't need as many cattle today today to produce the same amount of beef as we did in 60 years ago.  Still, fewer cattle numbers means less beef, and less beef supplied means higher prices.  Contraction in cattle supplies can be explained by a number of factors, such as drought in the plains states that limited the amount of grass and hay available and higher feed (mainly corn) prices due to drought, ethanol policy, etc., which pushed pushed more cattle to slaughter several years ago, leading to smaller inventories today.  Feed prices have now come down off their highs but cattle prices are still rising, partially because producers are holding back breeding stock to rebuild inventory.  Still, if high feed prices were THE answer, I would have expected chicken prices to rise in tandem with beef and pork (at least over part of the period), but as the above graph reveals, they didn't.
  • It is also worth noting that on the supply side, the beef industry has stopped using technologies that previously generated more meat from each animal.  
    • The industry largely moved away from using lean fine textured beef (LFTB - aka "pink slime") in March 2012.  It has been estimated that not using LFBT is akin to reducing the cattle supply by about 1 to 1.5 head million annually.  So, removal of LFTB had an effect of further reducing supply on top of the other aforementioned factors.  One study suggests that removal of LFTB increased ground beef prices by about 3.5%.  Here is a recent TV news story about the role of LFTB and beef prices (I was happy to see they interviewed Kate Brooks from University of Nebraska - one of my former students).
    • The industry also moved away from using the beta-agonist, Zillmax.  According the the product's manufacturer, Zilmax added 24-33 lbs of additional hot carcass weight.  Multiply that by millions of head of cattle, and that's millions of pounds of beef that are now "missing" relative to a year or two ago.  
  • On the pork side of the equation, there is a lot of concern about the porcine epidemic diarrhea virus (PED), which is kills young pigs.  It is yet unclear what effects it may be having, but speculation suggests it might be tightening supplies and pushing up pork prices.  This is a relatively recent phenomenon and can't explain the 2010-2011 increases.

Addendum:

Scott Irwin sent me a note with a couple links to posts at farmdocdaily, which touch on these same issues.  First, he noted (in a post almost four years ago!) that the corn/soy prices then were likely to lead to much higher livestock prices.  So what we are seeing now may be the fruition of this longer-term adjustment.  Second, Chris Hurt posted on March 3 about PED, and it does appear to be a big deal - hog futures are at record levels.  Chris concluded:

At the farm level, current futures markets are suggesting a live price for 2014 at a record high of $73 per hundredweight compared to $64 last year. This will provide record high industry revenues and the highest profit per head since 2005.

Who is going to pay for these record high pork producer revenues? Unfortunately, the consumers of pork are expected to be large net losers from PED-V as they will have to pay record high retail pork prices and also have less pork availability.

Effects of sub-therapeutic antibiotics on efficiency of hog farms

From a recent article appearing in the American Journal of Agricultural Economics by USDA economists Nigel Key and William McBride:

A substantial share of U.S. hog producers incorporate antimicrobial drugs into their livestock's feed or water at sub-therapeutic levels to promote feed efficiency and weight gain. Recently, in response to concerns that the overuse of antibiotics in livestock could promote the development of antimicrobial drug-resistant bacteria, the U.S. Food and Drug Administration adopted a strategy to phase out the use of antibiotics for production purposes. This study uses a stochastic frontier model and data from the 2009 USDA Agricultural Resource Management Survey of feeder-to-finish hog producers to estimate the potential effects on hog output and output variability resulting from a ban on antibiotics used for growth promotion. We use propensity score nearest neighbor matching to create a balanced sample of sub-therapeutic antibiotic (STA) users and nonusers. We estimate the frontier model for the pooled sample and separately for users and non-users—which allows for a flexible interaction between STA use and the production technology. Point estimates for the matched sample indicate that STA use has a small positive effect on productivity and production risk, increasing output by 1.0–1.3% and reducing the standard deviation of unexplained output by 1.4%. The results indicate that improvements in productivity resulted exclusively from technological improvement rather than from an increase in technical efficiency.

Now, that doesn't mean sub-therapeutic antibiotics should be used in animal agriculture, but this does provide one estimate of the benefits that can be compared against the potential costs that might arise as a result of resistance, etc.

Strange Claims on Meat Consumption

Alison Spiegel at Huffington Post recently ran a story with the lead title: 

Chicken More Popular Than Beef In U.S. For First Time In 100 Years

As best I can tell, however, claim isn't true.  It is true that per capita consumption of chicken is increasing, but it surpassed beef back in the early 1990s.

The claim comes from a graph, which was reproduced from a story by Priceonomics,who in turn took it from Angela Wong at NPR, who in turn cites the Earth Policy Institute.  Beyond that, I have no idea where the data come from.  

For context, here is the graph from Huffington Post:

percapitawrong.JPG

But, according to USDA data, per capita chicken consumption passed beef in about 1992.  Here, for example, is a graph from the Livestock Marketing Information Center (which uses USDA data).

percapitaright.JPG

Oddly, the Earth Policy Institute has, on their web site, a graph showing something similar to the LMIC.  

There may be a rational explanation for the discrepancy (such as differences in data sources or differences in what is being counted in "total chicken") but without any details we only have to guess.

One final point.  Yes, per capita consumption of chicken is on on the rise and has been higher than beef for now over 20 years (according to USDA data).  But, that is largely because chicken has become much less expensive and, lately, beef more expensive.  

Thus, I don't know that we should say chicken is more "popular" than beef.  Indeed, people SPEND much more money on beef than chicken - about twice as much as the following graph shows.  If we judge by dollars spent, beef is much more popular than chicken.

meatexp.JPG

The Cost of Corn in Meat

I recently ran across this publication from the USDA-Economic Research Service back in 2008.  The piece, written by Ephraim Leibtag, is mainly about the high costs of corn at the time (they subsequently went much higher), and the potential impacts on the cost of food.

That publication had a little back of the envelope calculation that I found very interesting, as it relates to the argument that meat production is wasteful - a topic I've discussed before.

Here is Leibtag:

To avoid downplaying potential impacts, this analysis uses upper-bound conversion estimates of 7 pounds of corn to produce 1 pound of beef, 6.5 pounds of corn to produce 1 pound of pork, and 2.6 pounds of corn to produce 1 pound of chicken.  Using these ratios and data from the Bureau of Labor Statistics, a simple passthrough model provides estimates of the expected increase in meat prices given the higher corn prices. The logic of this model is illustrated by an example using chicken prices. Over the past 20 years, the average price of a bushel of corn in the U.S. has been $2.28, implying that a pound of chicken at the retail level uses 8 cents worth of corn, or about 4 percent of the $2.05 average retail price for chicken breasts. 

I don't know about you, but 8 cents doesn't seem like a lot.  If that corn is "wasted" (I've previously argued that "waste" is the wrong word here), that's not much waste.

I don't know exactly how Leibtag made his calculation, but I'll make an even cruder one using current figures.  The price of corn today is around $4.15/bushel.  There are 56lbs in a bushel, so corn costs $0.074/lb.  So, if a steer requires 7 lbs of corn to make 1 lb of beef, then the cost of the corn in a pound of beef is: $0.074*7 = $0.519.  The retail price of beef today is around $5/lb, so about 10.3% of the retail price of beef is feed corn.  That means about 90% of the retail price of beef is due to other stuff.  

Similar calculations show that for a pound of pork $0.48 of the retail cost is due to corn and for chicken it is $0.19 (this is higher than Leitbag's numbers because, among other things, the cost of corn today is much higher and because my calculation also underestimates the costs of feed in a pound of retail product because it doesn't take into account the ability of farmers to substitute toward cheaper feeds).  Given retail prices of for pork and chicken are $3.8/lb and $2/lb, that means that 12.8% and 9.9% of the retail prices of pork and chicken.  

So, the vast majority of the cost of meat - around 90% - is due to non-feed factors.  

Sometimes a little context is useful in these debates.