Blog

Meat Consumption in 2018

An article in Bloomberg today reports on a USDA forecast that per capita meat consumption is projected to hit a high in 2018 of 222 pounds per person.  I received a number of emails from people today asking how this is possible.  Questions were of the sort: Aren't there more vegetarians than ever? Isn't plant-based protein and lab grown meat taking off? Aren't people more worried about environmental and health effects of animal production?  Aren't animal welfare concerns on the rise?

Embedded in many of these questions is conflation of demand and supply.  Yes, consumers are projected to consumer more meat in 2018, but that’s because we’re producing more of it than was the case a few years ago.  We consume everything that’s produced (after adjusting for trade).  In short, it's not that demand for meat has increased (what people are willing to pay for meat has remained fairly steady for the past several years - see also these beef and pork demand indices).  Rather, the supply of meat has increased.   

How do I know this is true?  If there were a demand increase, we'd expect higher quantities and higher prices.  But, at least compared to a couple years ago, we're seeing higher quantities but lower beef and pork prices, suggesting it is the supply curve that has shifted. To induce people to consume the higher volume of meat that’s currently being produced, prices have to fall to clear the market.

So, why have supplies increased?  One main reason is that feed prices (particularly corn) dropped and have remained low for the past several years.  All the while, productivity has increased.  Lower input prices and greater inefficiencies means we are going to have more meat as long as consumer demand remains steady.  And at least for now, despite all the negative information about meat production I alluded to earlier, demand appears to be fairly stable.  

Plant-based is the new local (Impossible Burger edition)

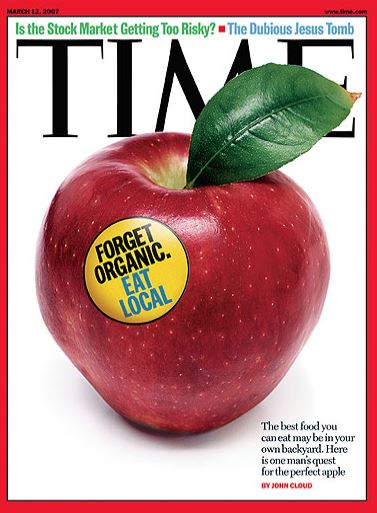
Back in 2007, Time magazine ran the following cover announcing, in essence, that local was the new organic.

timemag.JPG

Well local, has arrived and now it seems it's time to move on to something else.  Last night, I heard Randy Krotz, CEO of the US Farmers and Rachers alliance give a presentation, and as he talked he helped solidify some thoughts that have been rolling around in my head for a while. 

In short, forget local, eat "plant based."  "Plant based" appears to be the new local.  

Randy must have been prescient because, as it turns out, right after his talk, my son (who graciously agreed to attend the meeting with me) and I decided to stop for a burger, and lo-and-behold the joint offered the Impossible Burger.  This is the first time I've seen the plant-based burger - which used genetically engineered yeast to produce animal proteins - listed on a menu.  My son ordered the Impossible Burger, and I went with the good old-fashioned cow burger, which allowed a side-by-side taste test.  

impossibleburger.JPG

Overall, I give the Impossible Burger high marks.  If we didn't know it was plant-based, I don't think we would have been the wiser.  My son thought it was quite good.  It is certainly 100% better than previous vegetarian burgers I've tried.  That said, there was just something about the beef burger that we thought tasted better - I suspect it was the animal fat.  Still, traditional animal-based protein suppliers have due cause for concern from this new competition.  That is, if these new technologies can bring down cost.  

The Impossible Burger was about a dollar more expensive (and about half the thickness) of the beef burgers on the menu, which prompted some discussion between my son and I about relative costs of animal- vs. plant-based proteins.  The ad on the table claims that the Impossible Burger uses 95% land, 97% less greenhouse gas emissions, and 74% less water than a beef burger.  If the Impossible Burger is using so many fewer resources, why is it more expensive?  Land is an enormously costly input.  Some of it may be that they are trying to recoup R&D costs or that they are exercising some price discrimination as they sell to higher income consumers.  At this point, it's hard to know, but if it is really the case that the plant-based burger uses substantially fewer resources, it should ultimately cost less than animal-based proteins.

All that is a way of pointing out that these sorts of plant-based burgers aren't a free lunch.  All those genetically engineered yeast have to "eat" something.  They require stainless steel fermentation vats, produce waste (that ironically is probably best used as feed for livestock), etc.  It will be interesting to see how cost-competitive they can become and how accepting consumers may (or may not be).          

Meat Taxes?

This morning I appeared on Fox Business Network with Varney & Co to discuss the idea of meat taxes (something proposed by many groups and authors - e.g., see this recent piece in Bloomberg).  The short segment is below.  It cut out before my last comment where I argued that efficiency is also good for the consumer because it helps bring down food prices.

Are Steaks Too Big?

Then answer, according to a paper just published in the journal Food Policy by Josh Maples, Derrell Peel, and me is "yes" - at least for most consumers.  

The issue is that improved genetics and feeding technologies, along with various economic incentives, have led to much larger cattle.  To provide some perspective, USDA data indicate that the average weights of commercially slaughtered cattle hovered around 1,000 lbs from the 1950s and the mid 1970s.  Since that time, however, there has been a fairly steady increase in the size of cattle.  Since 1975, finished cattle weights have increased about 9 lbs/year on average.  In 2016, the average weight was 1,363 lbs.  That's a whopping 366 lbs higher in 2016 than in 1975!

Larger cows mean larger steaks.  On the surface, that seems like a good thing for consumers as it means we have more steaks.  However, most people don't want to eat a 32oz steak.  In fact, most restaurants and grocery stores offer relatively fixed serving sizes for steaks like 12oz or 16oz, for examples.  So, what happens if cattle carcasses have gotten much bigger, and along with it, the muscles that are cut into steaks, but consumers still only want a 16oz steak?  The consequence is that today, steaks are cut thinner.  Thus, the core question is: for a fixed weight, do consumers prefer "traditional" thicker steaks that take up a smaller area or "newer" thinner steaks that take up a larger area?  

To answer this question, we surveyed over 1,000 US consumers and presented them with a series of choices like the following that varied the type of steak, the thickness or the steak, the area of the steak, and price.  Note that one you know the thickness and the area of a steak, the weight is pre-determined.  


steakCE.JPG

The findings?

Our results imply that consumers are heterogeneous in preferences for steak size but are generally in unison in their dislike for the thinnest cuts of steaks

About half the consumers preferred steaks with the largest area, but about half preferred steaks with a medium-sized area.  Overall, the results suggest that the roughly 50% of consumers who prefer steaks with larger areas is way more than offset by the near universal dislike of steaks becoming much thinner.   

Here's an excerpt from the conclusion:

The decrease in consumer welfare by moving from a choice set containing small area and thick steaks to a choice set that includes large area and thin steaks implies that the changes in carcass size have led to a decrease in consumer utility from today’s steak choices relative to the steak choices of a few decades ago. The aggregate welfare loss from the increase in carcass weight with respect to ribeye and sirloin steaks is $8.6 billion for the two largest classes. Of course, steaks are only one piece of the carcass, and the increase in carcass size may have increased welfare with respect to other beef cuts. The decrease in welfare due to larger steaks can be offset by increased welfare resulting from the increases in quantity produced of other cuts. Ground beef is a prominent example. Because the form of this product remains generally unchanged as carcass size increases, the increased efficiency (i.e. more meat per animal) has likely led to increases in consumer welfare through lower prices (or smaller increases in prices resulting from the decrease in number of cattle slaughtered). However, steaks represent an important portion of the total carcass value and it is possible that the increasing size of other cuts have also created less desirable end products for consumers. Future research should focus on the impact of increased carcass weights on consumer welfare across multiple cuts. Such studies might find that while welfare losses exist for some cuts, the gains in welfare from other cuts lead to a net increase in consumer welfare due to larger cattle.

How Much Does Your State Rely on Other States for Food?

With all the ongoing discussion of benefits and costs of trade and NAFTA, I thought it might be useful to look at some agricultural trade within the United States.  We don't usually think of sending corn from Iowa to Louisiana as "trade" but it's hard to see how it is much different than sending corn, for example, from Iowa to Alberta, except of course for crossing national rather than state boarders.  These sorts of discussions also relate to efforts to move toward local and regional food systems.  How feasible is it, really, for a state to "feed itself"?  

Unfortunately, there simply isn't good data on how much states trade with each other. Thus, I thought I'd make some very crude calculations based on a variety of tenuous assumptions.  First, I'll report what I found and then discuss the details and assumptions I had to make below.  

importexport.JPG

The table above shows my crude calculation of how much a state imports or exports for various food products on a per-capita basis.  For example, for every Iowan, 3,896 lbs of hogs leave the state for every pound that comes in.  Iowa is thus a net exporter of hogs/pork.  By contrast, for every New Jerseyan, 111 lbs of hogs enter the state for every lb that leaves New Jersey.  New Jersey is a net importer of hogs.  By these calculations, 11 states "feed" the other 39 states pork. 

For eggs (this includes both table eggs and hatching eggs because these were the most complete data available at the state level), in Iowa, 3,747 eggs per person leave the state for every egg that enters the state.  These calculations suggest Massachusetts and the District of Columbia are the largest net importers of eggs with more than 300 eggs entering the state/district per person for every egg that leaves.     

For cattle, 18 states "export" lbs of cattle on a per capita basis and the other 32 states import lbs of cattle.  Rice is the most extreme case shown.  Only six US states produce meaningful quantities of rice according to USDA; people in the rest of the US have to import from these locations.

A state like Massachusetts, for example, heavily relies on other states for these four agricultural products.  The average Bostonian imports 110 lbs of hogs, 302 eggs, 130 lbs of cattle, and 62 lbs of rice from other states.  California is a big producer of agricultural products, but it is also a populous state, and as a result, it is also a net importer of hogs, eggs, and cattle.  

***

On the details of the calculations -  I'll admit up front that the figures in the above table leave a lot to be desired.  I'll describe what I've done and leave it to the reader to decide whether there is more information than noise.  

I went to USDA-NASS data and obtained production by state. The USDA doesn't always report production for all states, and in many cases, it withholds reporting for some states due to confidentiality issues.  In these cases, I "fudged" and simply divided the total production that was unaccounted for equally among states for which the USDA did not report data.  

These USDA data yield crude estimates of production by state.  We do NOT have good data on consumption by state, but we do have data on population by state.  Making the assumption that per-capita consumption of various food products is the same in every state, we can then make an inference as to how much of any food product is consumed in a state.  It is simply the share of the US population in a given state multiplied by the total US production of a given agricultural commodity.  The difference in the state production and the inferred state consumption is a crude estimate of net exports/imports into a state.  I then divided the total pounds (or eggs) of net exports/imports by a state's population to put the figures in per capita terms.  

There are some shortcomings with these calculations.  First, I've ignored trade with other countries.  For example, if eggs leave Iowa for Mexico, then the above figures over-state how many eggs are consumed within a given state in the US.  I similarly ignore imports, which will instead under-state how much is imported into certain states.  Also, the figures above suggest per-capita consumption numbers that are substantially higher than that reported by the USDA-Economic Research Service.  The main reason, for beef and pork, is that the USDA production data report farm-level lbs produced by a state not the amount of retail meat lbs.  There is some double counting in these figures.  If an Indiana farmer raises a hog to 20 lbs and then sells it to a finishing operation in Illinois that raises the hog to 200 lbs, then the USDA statistics will say Indian had 20 lbs of production and Illinois had 200 lbs of production, which added together is 220 lbs.  But, there aren't 220 lbs of pork, only 220. The way around this would be to only count retail lbs produced, but the USDA doesn't report this on a state level for pork or beef.  Also, there are a lot of other foods, like vegetables or table eggs, that we might desire to create statistics like those in the above table; however, there is very sparse reporting at the state-level by the USDA, and often the "other states" category has more quantity produced than the total of the quantity specified for named states.