Fantastic video explaining how to put the engineering back into genetic engineering - aka synthetic biology (HT Marc Brazeau at Genetic Literacy Project)
Blog
On Crop Insurance
The UC Berkeley economist Brian Wright provocatively begins an article in Choices Magazine as follows
“Consider a deal where, for about 200,000 farmers, every dollar they can pay to the government in crop insurance premiums will give them an expected return of $1.90 as J.W. Glauber reported was the case for 1990 to 2011. Imagine that it costs the taxpayers at least $1.10 to get farmers paid that expected a 90-cent profit (Glauber, 2013). Imagine that this deal has just been sweetened further with a new set of giveaways in the legislation that is widely called the 2014 Farm Bill, at the end of a half-decade called the “great recession” when farm families’ wealth has soared to over eight times that of the average American family (Bricker et al., 2012; and U.S. Department of Agriculture (USDA), 2014). In an ingenious and successful political marketing campaign, farmers continue to promote public support for this deal as crop “insurance.””
Smaller plate size = lower consumption?
Having read a couple papers that looked at the amount of food people ate when using smaller vs. larger plates, I presumed it was something of a stylized fact that people ate less when using smaller plates. However, this review study just released in Obesity Reviews, suggests that
“Evidence to date does not show that dishware size has a consistent effect on food intake, so recommendations surrounding the use of smaller plates/dishware to improve public health may be premature.”
Guess I need to update my beliefs on this one. Here's the whole abstract:
“It has been suggested that providing consumers with smaller dishware may prove an effective way of helping people eat less and preventing weight gain, but experimental evidence supporting this has been mixed. The objective of the present work was to examine the current evidence base for whether experimentally manipulated differences in dishware size influence food consumption. We systematically reviewed studies that experimentally manipulated the dishware size participants served themselves at a meal with and measured subsequent food intake. We used inverse variance meta-analysis, calculating the standardized mean difference (SMD) in food intake between smaller and larger dishware size conditions. Nine experiments from eight publications were eligible for inclusion. The majority of experiments found no significance difference in food intake when participants ate from smaller vs. larger dishware. With all available data included, analysis indicated a marginal effect of dishware size on food intake, with larger dishware size associated with greater intake. However, this effect was small and there was a large amount of heterogeneity across studies (SMD: −0.18, 95% confidence interval: −0.35, 0.00, I2 = 77%). Evidence to date does not show that dishware size has a consistent effect on food intake, so recommendations surrounding the use of smaller plates/dishware to improve public health may be premature.”
Fat and Happy
I ran across this interesting paper by Frieder Kropfhäußer and Marco Sunder. They study the relationship between body mass index (BMI) and life satisfaction for about 8,000 Germans measured from 2003 to 2011.
Life satisfaction was measured via survey by asking people how satisfied they were with their life on a scale of 0=dissatisfied to 10=satisfied.
I used their estimates for all men and all women in their table 3 to construct the following graph.
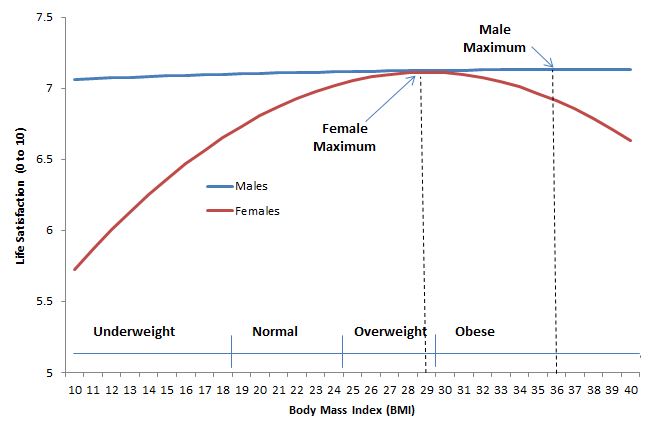
They find no statistically significant relationship between BMI and life satisfaction for men (after controlling for earnings, age, education, and marital status). If you had to predict the BMI that would yield highest life satisfaction for men, it would be 36 - well into the obese range.
For women, there is a clearer relationship. Even still, the life-satisfaction-maximizing BMI for women is about 29, at the upper end of overweight and almost obese.
Now, maybe BMI affects earnings or marital status, which then has an indirect effect on life satisfaction; however, these results suggest that overweightedness in and of itself doesn't have much effect on the stated life satisfaction of men, and the "optimal" for women is far above what obesity researchers consider "normal."
It's hard to reconcile these findings with so much of what we read about obesity.
Who are the vegetarians?
One of the challenges researchers face in trying to learn about the characteristics of vegetarians is that there are so few of them. I've seen estimates that put the percentage of vegetarians in the US population as high as 13%, but most estimates are closer to 5%. That means that if one does a survey that has 1,000 respondents (which is a pretty typical sample size for pollsters), you'll only have about 50 vegetarians in the sample - hardly a large enough sample size to say anything meaningful.
We've been running the Food Demand Survey (FooDS) for 19 months now, and each monthly survey has over 1,000 respondents. I took the first years' data (from July 2013 to July 2015), which consists of responses from over 12,000 individuals. This sample is potentially large enough to begin to make some more comprehensive statements about how vegetarians might differ from meat eaters in the US.
Applying weights to the sample that force the sample to match the population in terms of age, gender, region of residence, etc., we find that 4.2% of respondents say "yes" to the following question: "Are you a vegetarian or a vegan?", which means that 95.8% say "no".
There is some sampling variability from month-to-month, but overall, the trend in the percentage of respondents declaring vegetarian/vegan status has remained relatively constant, and if anything, has trended slightly downward over time.

So, how do self-declared vegetarians/vegans differ from meat eaters? The following table shows differences/similarities in socio-economic and demographic characteristics.

Some of the biggest differences appear for age, race, overweight status, and politics. Vegetarians tend to be younger, less white, skinnier, and more liberal than meat eaters. Two unexpected results are that vegetarians indicate a much higher rate of food stamp participation (which is a bit surprising since the share of households with >$100K in income is higher for vegetarians than meat eaters) and a much, much higher rate of food-borne illness.
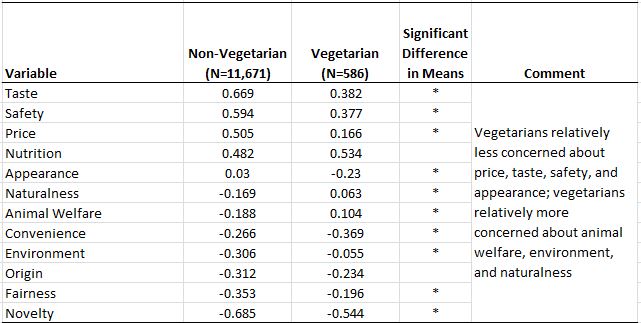
In our survey, we also measure respondents' "food values" (for detail on the approach, see this academic paper we published). This approach requires people to make trade-offs (they cannot say all issues are most important). Respondents are shown a set of 12 issues and are asked to place 4 (and only 4) of them in a box indicating they are the most important issues when buying food, and to also place 4 (and only 4) issues in a box indicating they are the least important issues when buying food. We measure relative importance by subtracting the share of times an item appears in the least important box from the share of times it appears in the most important box. Thus, relative importance is on a scale of +1 to -1, and average scores across all 12 items must to sum to zero.
Meat eaters tend to rate taste and price as relatively more important food values than vegetarians. Vegetarians tend to rate animal welfare and the environment as more important food values than meat eaters. Even still, vegetarians rate nutrition, taste, price, and safety as more important food values than animal welfare or the environment.
The survey also shows people a list of 16 issues and respondents indicate how concerned they are about each issue (1=very unconcerned to 5=very concerned). As the table below shows, vegetarians are more concerned about all issues than are meat eaters, even an issue like GMOs which is (at present) primarily a plant issue. The difference in level of concern between vegetarians and meat eaters is particularly large for gestation crates, battery cages, and farm animal welfare.

Given some previous discussion on the economics of Meatless Monday, I ran some statistical models to determine whether vegetarians tend to spend more or less on food than meat eaters.
Without controlling for any differences in income, age, etc. that were found in the initial table above, I do not find any statistically significant differences in spending patterns. Meat eaters report spending about $94/week on food eaten at home and vegetarians report spending about $3 less (a difference that isn't statistically significant); meat eaters report spending about $46/week on food eaten away from home (e.g., at restaurants) and vegetarians spend about $9.80 more (a difference that isn't statistically significant). Even after I control for differences in income, age, etc., I do not find any significant differences in food expenditures between vegetarians and meat eaters. The biggest determinants of food spending is income (high income individuals (>$100K in income) spend $35/week more away from home than low income (<$40K in income)) and household size (larger households spend more). Younger people spend about the same as the older on food a home, but spend more eating out than do the old.