Blog

Consumer Uncertainty about GMOs and Climate Change

A lot of the debate and discussion surrounding public policies toward controversial food and agricultural issues like GMOs or climate change revolves around public sentiment.  We ask people survey questions like "Do you support mandatory labeling of GMOs?"  However, as I've pointed out, consumers may not even want to have to make this sort of decision; they would prefer to defer to experts.  Thus, we're presuming a level of understanding and interest that consumers may not actually have.  This is related to the recent discussion started by Tamar Haspel in the Washington Post about whether the so-called food movement is large or small.  Are "regular" people actually paying much attention to this food stuff that occupies the attention of so many journalists, researchers, writers, and non-profits?

I had these thoughts in mind as I went back and looked at this post by Dan Kahan who took issue with Pew's survey on public opinions about GMOs (this was the survey that attracted a lot of attention because it showed a large gap in public and scientific opinion on GMOs).  Kahan wrote:

the misimpression that GM foods are a matter of general public concern exists mainly among people who inhabit these domains, & is fueled both by the vulnerability of those inside them to generalize inappropriately from their own limited experience and by the echo-chamber quality of these enclaves of thought.

and

That people are answering questions in a manner that doesn’t correspond to reality shows that the survey questions themselves are invalid. They are not measuring what people in the world think—b/c people in the world (i.e., United States) aren’t thinking anything at all about GM foods; they are just eating them.

The only things the questions are measuring—the only thing they are modeling—is how people react to being asked questions they don’t understand.

This let me to think: what if we asked people whether they even wanted to express an opinion about GMOs?  So, in the latest issue of my Food Demand Survey (FooDS) that went out last week, I did just that.  I took my sample of over 1,000 respondents and split them in half.  For half of the sample, I first asked, "Do you have an opinion about the safety of eating genetically modified food?"  Then, only for people who said "yes", I posed the following: "Do you think it is generally safe or unsafe to eat genetically modified foods?" For the other half of the sample, I just asked the latter question about safety beliefs and added the option of "I don't know".  This question, by the way, is the same one Pew asked in their survey, and they didn't even offer a "don't know" option - it had to be volunteered by the respondent.  So, what happens when you allow for "I don't know" in these three different ways? 

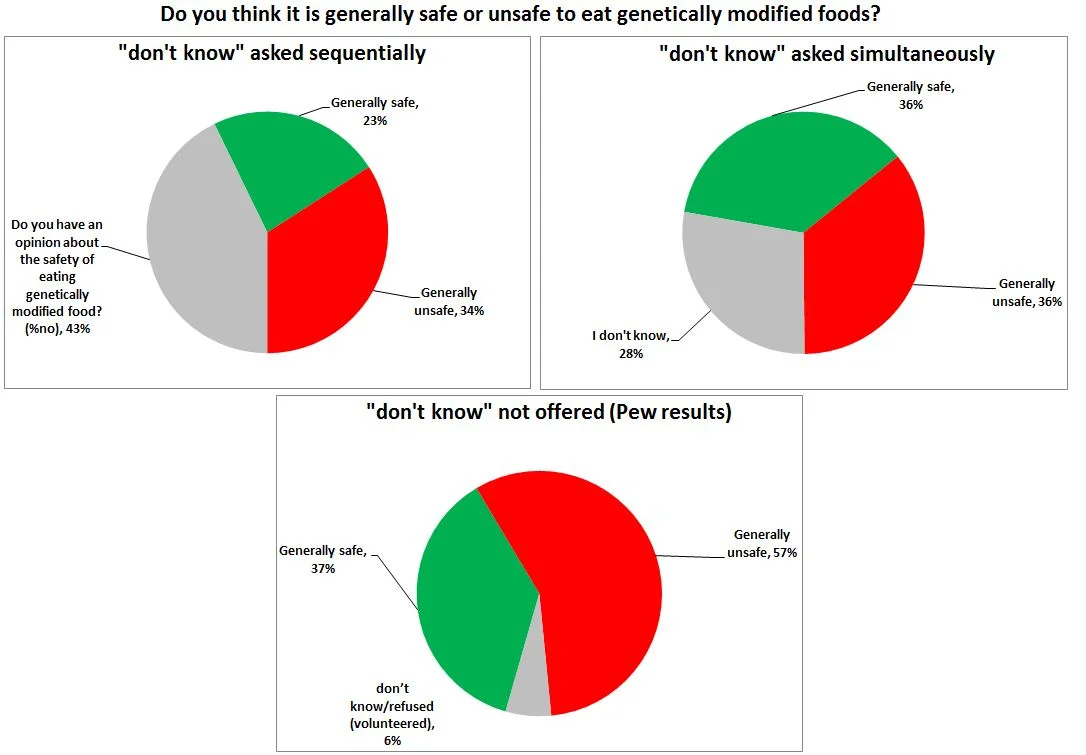
When "don't know" is asked 1st in sequence before the safety question, a whopping 43% say they don't have an opinion!  By contrast, only 28% say "don't know" when it is offered simultaneously with the safety question.  And, as the bottom pie graph shows, only about 6% of respondents in the Pew survey voluntarily offer "don't know".  Thus, I think Kahan's critique has a lot of merit: a large fraction of consumers gave an opinion in the Pew survey, when in fact, they probably didn't have one when this option was allowed in a more explicitly matter.  

Moreover, allowing (or not allowing) for "don't know" in these different ways generates very different conclusions about consumers' beliefs about the safety of GMOs.  Conditional on having an opinion, the percent saying "generally safe" varies from 40% in the sequential question to 50% in the simultaneous question to 39% in the Pew format which didn't offer "don't know."  That support can vary so widely depending on how "don't know" is asked is hardly indicative of stable, firm, beliefs about GMOs among the general public. 

In last week's survey I also carried out the same exercise regarding Pew's questions on climate change.  For half of my sample, I first asked whether people had an opinion about the causes of changes in the earth's temperature; for the other half, I included "don't know" as an option simultaneous with the question itself.   Here are the results compared to Pew's, which again did not explicitly offer a "don't know."  

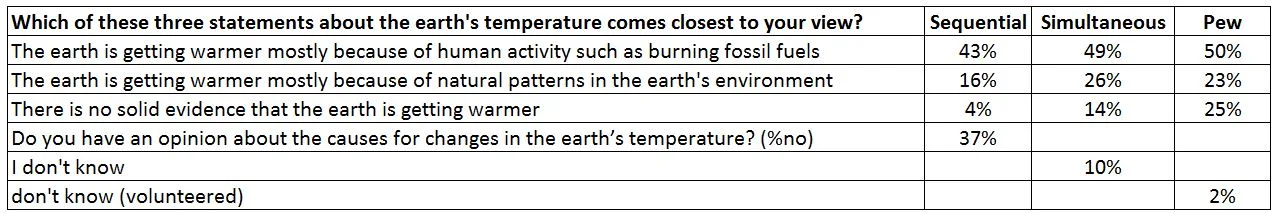
Again, we see big differences in the extent to which "don't know" is expressed depending on question format, varying from 37% in the sequential version to only 2% in Pew's survey.  In this case, it appears that people who would have said "don't know" in the sequential question format are more likely to pick response categories that disagree with scientists, when they are given questions where "don't know" isn't so explicitly allowed.  

What can we learn from all this?  Just because people express an opinion on surveys doesn't mean they actually have one (or at least not a very firmly held one).  

Food Demand Survey (FooDS) - February 2016

The February 2016 edition of the Food Demand Survey (FooDS) is now out.

A few highlights:

  • Willingness-to-Pay for most meat products was relatively steady except for an increase in WTP for ground beef and pork chops and a decrease for chicken wings (note: the timing of the survey fell after the Super Bowl weekend).
  • There was a large change in price expectations.  Consumers expect lower meat prices than they did a month ago.  In fact the expectations are as low as they've been since the survey started in May 2013.   
  • There was an increase in awareness of bird flu in the media over the past couple weeks.
  • There was lower concern expressed about both "pink slime" and "lean finely textured beef."

Several new ad hoc questions were added to the survey this month. Some questions related to GMO safety beliefs, and how they varied with the ability of consumers to express uncertainty.  There's a lot to discuss on that topic, so these questions will be discussed separately.

The other ad hoc question was added for a bit of fun.  Given the busy election season, we asked respondents, “Who do you plan to vote for in the presidential primary election?” A list of 16 options was then provided.


The majority of respondents replied “I don’t know”. Donald Trump (R) and Hilary Clinton (D) were the two candidates with the most planned votes, followed closely by Bernie Sanders and “I do not plan to vote.” After Trump, all other listed Republican candidates garnered a cumulative 16% of the anticipated vote.

Out of curiosity , we took a look at how some of the answers to other survey questions varied with anticipated presidential voting (recognizing of course that the sample sizes are relatively small for each candidate, and thus the margins of errors wide).

Donald Trump supporters had the highest concern for E. Coli and placed the lowest relative importance on the food values of naturalness and the environment; Trump supporters were the biggest beef, pork, and overall meat eaters (but ate the least chicken breast). Sanders supporters eat the least beef, pork, and total meat.

Clinton and Sanders supporters placed the least relative importance on food prices. Clinton supporters were the most concerned about GMOs, and placed the highest relative importance on naturalness, nutrition, and environment when buying food. 

Effects of Crop Insurance Subsidies

The journal Applied Economics Perspectives and Policy just published my paper entitled, "Distributional Effects of Crop Insurance Subsidies."  Farmers of the major commodity crops (and increasingly even minor crops including fruits and vegetables) are eligible to buy subsidized crop insurance.  The insurance is, in principle, priced at actuarial fair rate (i.e., the price of the insurance is equal to the expected loss), but the government subsidizes the insurance premium paid by the farmer (in addition to some of the costs of the insurers).  The average subsidy is around 65% of the premium amount.  If there were a similar program for your car insurance, and the annual premium you pay for your car is $1000/year, you'd get back $650 in subsidy.  In addition to this premium subsidy, the latest farm bill also has provisions to subsidize the deducible in the case of a loss.  All this begs the question: what impact do these subsidies have on food prices and production?  

From the abstract:    

Results indicate that the removal of the premium subsidy for crop insurance would have resulted in aggregate net economic benefits of $622, $932, and $522 million in 2012, 2013, and 2014, respectively. The deadweight loss amounts to about 9.6%, 14.4%, and 8.0% of the total crop insurance subsides paid to agricultural producers in 2012, 2013, and 2014, respectively. In aggregate, removal of the premium subsidy for crop insurance reduces farm producer surplus and consumer surplus, with taxpayers being the only aggregate beneficiary. The findings reveal that the costs of such farm policies are often hidden from food consumers in the form of a higher tax burden. On a disaggregate level, there is significant variation in effects of removal of the premium subsidy for crop insurance across states. Agricultural producers in several Western states, such as California, Oregon, and Washington, are projected to benefit from the removal of the premium subsides for crop insurance, whereas producers in the Plains States, such as North Dakota, South Dakota, and Kansas, are projected to be the biggest losers.

Because producers in different states grow different crops, the effects of the subsidies aren't equally dispersed.  I write:

Take for example the comparison of California, which generated about $32.6 billion in annual food-related agricultural output from 2008 to 2012 and Kansas, which generated about $11.2 billion over the same time period. Despite the fact that California generates about three times more agricultural output than Kansas, Kansas farmers received 2.65 times the amount of crop insurance subsidies and attributed overhead ($618 million vs. $233 million) in 2013. Moreover, the states are radically different in terms of the types of agricultural commodities grown. Just under 70% of the value of all food-related agricultural output in California comes from fruits, vegetables, and tree nuts; for Kansas, the figure is only 0.04%.

These differences in commodities produced lead to differences in the uptake of crop insurance subsidies and the prices paid in each location.

To illustrate how this heterogeneity comes about, again consider California and Kansas and the results from 2013. Removal of premium subsidies is projected to increase vegetable (a major California crop) prices by 1.4% and wheat (a major Kansas crop) prices by 7.9% (aggregate reductions in quantities are 0.2% and 3.1%, respectively). The implicit subsidy lost by California producers of vegetables is only 0.16%, whereas the implicit subsidy lost by Kansas producers of wheat is 12%. Thus, California vegetable producers gain an effective price advantage of 1.4% −0.16% = 1.24% whereas Kansas wheat producers experience an effective price change of 7.9% −12% = −4.1%. Therefore, California vegetable producers sell about the same amount of output at about 1% higher effective prices, but Kansas wheat growers sell less output at about 4% lower effective prices. As a result, California producers benefit and Kansas producers lose from the removal of food-related crop insurance premium subsidies.

Even the results in figure 4 mask within-state heterogeneity. For example, despite the fact that Kansas wheat farmers are net losers, California wheat farmers are net winners. Why? Because the implicit price subsidy to California wheat farmers is much lower than the one to Kansas (3.6% vs. 12%). But, not all California producers benefit. California barley, hog, poultry, and egg producers are projected to be net losers from the removal of crop insurance subsidies. Within Kansas, wheat producers lose about $86 million but cattle producers gain about $12 million annually from the removal of the premium subsidy for crop insurance

Who moved my corn?

I have the great pleasure of giving a talk this week at the annual meeting of the Australian Agricultural and Resource Economics Society (AARES).  Tonight they held their awards ceremony, and I happened to be sitting next to Phil Pardey from the University of Minnesota who won (along with Jason Beddow) one of the research awards for a paper they published in the Journal of Economic History titled "Moving Matters".  

This is a fascinating paper that documents the movement of corn production over time in the US.  The paper illustrates the impact of hybrid and then genetically modified corn influencing what can be grown and where.  Changes in genetics and management practices allowed the corn plant to move  to soils that best suited the production of the crop.  As a result, they calculate that upwards of 21% of the growth in corn production can be explained by the geographic movement of the crop.   The results have implications for assumptions about impacts of climate change (i.e., that farmers can adapt by moving which crops, and which genetics, are planted where in response to changing temperatures) and for arguments about local foods (i.e., the sustainable production of crops depends on location of production, and allowing farmers to specialize in the geographic production of a crop can dramatically increase production).  

Here's the abstract:

U.S corn output increased from 1.8 billion bushels in 1879 to 12.7 billion bushels in 2007. Concurrently, the footprint of production changed substantially. Failure to take proper account of movements means that productivity assessments likely misattribute sources of growth and climate change studies likely overestimate impacts. Our new spatial output indexes show that 16 to 21 percent of the increase in U.S. corn output over the 128 years beginning in 1879 was attributable to spatial movement in production. This long-run perspective provides historical precedent for how much agriculture might adjust to future changes in climate and technology.

And, an interesting graph:

Do Survey Respondents Pay Attention?

Imagine taking a survey that had the following question. How would you answer?

If you answered anything but "None of the Above", I caught you in a trap.  You were being inattentive.  If you read the question carefully, the text explicitly asks the respondent to check "None of the Above."  

Does it matter whether survey-takers are inattentive?  First, note surveys are used all the time to inform us on a wide variety of issues from who is most likely to be the next US president to whether people want mandatory GMO labels.  How reliable are these estimates if people aren't paying attention to the questions we're asking?  If people aren't paying attention, perhaps its no wonder they tell us things like that they want mandatory labels on food with DNA.

The survey-takers aren't necessarily to blame.  They're acting rationally.  They have an opportunity cost of time, and time spent taking a survey is time not making money or doing something else enjoyable (like reading this post!).  Particularly in online surveys, where people are paid when they complete the survey, the incentive is to finish - not necessarily to pay 100% attention to every question.

In a new working paper with Trey Malone, we sought to figure whether missing a "long" trap question like the one above or missing "short" trap questions influence the willingness-to-pay estimates we get from surveys.  Our longer traps "catch" a whopping 25%-37% of the respondents; shorter traps catch 5%-20% depending on whether they're in a list or in isolation.  In addition, Trey had the idea of going beyond the simple trap question and prompting people if they got it wrong.  If you've been caught in our trap, we'll let you out, and hopefully we'll find better survey responses.  

Here's the paper abstract.

This article uses “trap questions” to identify inattentive survey participants. In the context of a choice experiment, inattentiveness is shown to significantly influence willingness-to-pay estimates and error variance. In Study 1, we compare results from choice experiments for meat products including three different trap questions, and we find participants who miss trap questions have higher willingness-to-pay estimates and higher variance; we also find one trap question is much more likely to “catch” respondents than another. Whereas other research concludes with a discussion of the consequences of participant inattention, in Study 2, we introduce a new method to help solve the inattentive problem. We provide feedback to respondents who miss trap questions before a choice experiment on beer choice. That is, we notify incorrect participants of their inattentive, incorrect answer and give them the opportunity to revise their response. We find that this notification significantly alters responses compared to a control group, and conclude that this simple approach can increase participant attention. Overall, this study highlights the problem of inattentiveness in surveys, and we show that a simple corrective has the potential to improve data quality.