Blog

Food Demand Survey (FooDS) - July 2016

The July 2016 edition of the Food Demand Survey (FooDS) is now out.  

Results reveal a reversal in the three-month slide in demand for meat products.   Willingness-to-pay (WTP) increased for all food products in July; there were sizeable increases in WTP for steak WTP (+46.44%) and deli ham (+33.15%) from June to July. This month, WTP for steak reached its highest point since FooDS began in May 2013. Compared to one year ago (July 2015), WTP is higher for all food products. 

Results also suggest an increase in spending at food away from home. Compared to June expenditures on food away from home were up 6.3% and there was a near doubling in plans to eat out more in July compared to June.  

Another major development was that this was the first time that farm animal welfare ranked in the top three issues of concern (behind E. Coli and Salmonella) since the beginning of FooDS.  

This month three new ad-hoc questions were added.  

The first dealt with the new GMO labeling bill I mentioned a couple days ago, which has been passed by the Senate and currently being considered by the House.   Participants were asked: “The US Congress is considering a bill that would require food companies to disclose whether a food contains genetically engineered ingredients. Food companies can comply by placing
text on packaging, provide a QR (Quick Response) code, or by directing consumers to a phone number or website. Do you support or oppose this legislation?”.

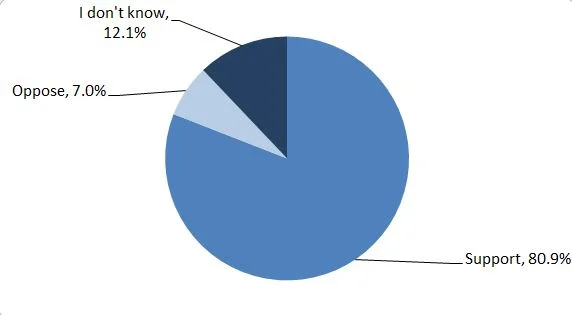
Approximately 81% of respondents stated they would support the bill, 7% said they would oppose the bill, and just over 12% of respondents stated “I don’t know”. 

At this point, we should all know these sorts of questions can be a bit misleading as consumers have very little information about the issue and can be shown to support other absurd policies like DNA labeling.  However, I'd read these results to suggest that mandatory GMO labels that include disclosure via QR codes do not substantively decrease consumer support for the policy.  

Second, participants were asked “Where do you tend to receive the most helpful and accurate information about food health and safety issues? (pick one issue)” Then 14 different sources were listed.

Local television news was listed most frequently as the most helpful and accurate information source (17%), while 11.7% of respondents said evening or nightly television news shows were the most helpful. Only 2.54% of participants listed books are their most helpful source of information. 5.37% of participants stated “other” as their most helpful source of information. Those who selected “other” gave examples including “NatrualNews.com”, “my own online research”, “Institute of Food Technologists mailing list”, “local highly educated farmer”, and “internet”.

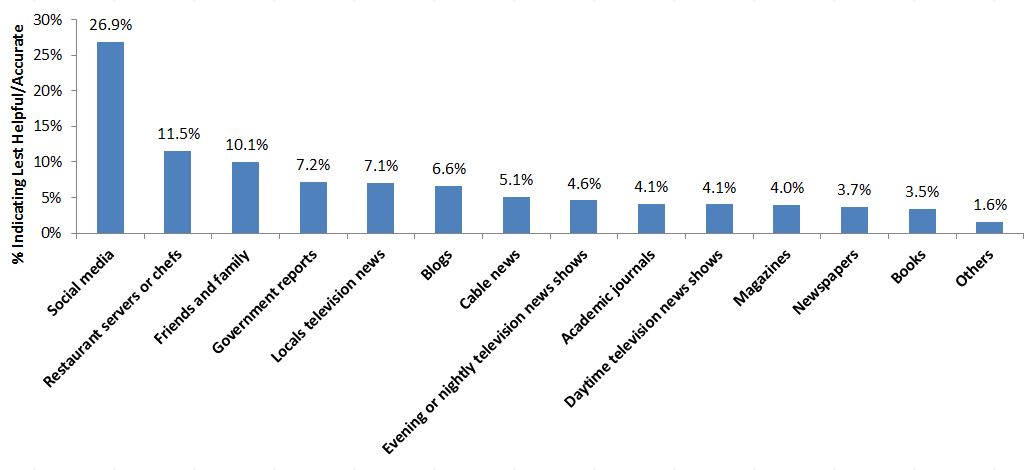
Last, respondents were asked: “Where do you tend to receive the least helpful and inaccurate information about food health and safety issues? (pick one)” The same 14 sources were listed as in the previous question.

By far, social media was the most frequently listed least helpful and inaccurate source of information about food health and safety issues at 27%. 11.5% of participants stated that restaurant servers or chefs were the least helpful and inaccurate source of information. Friends and family was ranked third, with 10.1% of participants. 1.6% of participants selected “other” as their least helpful and inaccurate source of information. Those who stated other, listed examples including “internet news”, “nurses”, “family who think they know”, “Youtube”, and “Packaging”. 

To further flesh out the results, the following chart plots the sources according to the percent of respondents indicating the source as most accurate vs. the percent indicating the source as least accurate. Sources on the bottom right of the figure would be more universally seen as most helpful land accurate, where as those on the top left of the figure would be just the opposite.

Restaurant chefs and servers are among least helpful/accurate with local television
news being among the most helpful/accurate. Friends and family are the most polarized group, with roughly equal numbers of consumers listing the source as most accurate and least accurate.

A few items

I was recently interviewed for the Food Sommelier podcast.  I had a fun conversation with the host Annette Hottenstein, and we had a wide-ranging discussion that ranged from soda taxes and local foods to obesity and food innovation.   

Hopefully the podcast will tide you over while I'm finishing up another great summer school on Experimental Auctions.  This year the course has been in Sicily, and its been a great class with lots of discussion on how we can figure out what consumers really want and what they're really willing to pay.  Here's a group photo on our weekend excursion to Mount Etna, the largest active volcano in Europe (yes, that's smoke coming from the mountain!).  

Mandatory GMO Labeling Closer to Reality

I've written a lot about mandatory labeling of genetically engineered foods over the past couple years, and given current events, I thought I'd share a few thoughts about ongoing developments.  Given that the Senate has now passed a mandatory labeling law, and discussion has moved to the House, it appears the stars may be aligning such that a nationwide mandatory GMO labeling will become a reality.  

The national law would preempt state efforts to enact their own labeling laws, and it would require mandatory labeling of some genetically engineered foods (there are many exemptions and it is unclear whether the mandatory labels would be required on only foods that contain genetic material or also those - such as oil and sugar - which do not).  Food manufacturers and retailers can comply with the law in a variety of ways including on-package labeling and via QR codes.  Smaller manufacturers can comply by providing a web link or phone number for further information.  

Many groups that have, in the past, advocated for mandatory labeling are against the bill because, they say, it doesn't go far enough (e.g., this group is upset because it doesn't "drive Frankenfoods . . . off the market."). Other anti-mandatory labeling folks also don't like the bill because of philosophical opposition to signalling out a technology that poses no added safety risks.  

I suppose this is how democracy works.  Compromise.  Neither side got everything they wanted, but at least from my perspective, this is a law that provides some form of labeling, which will hopefully shelve this issue and allow us to move on to more important things in a way that is likely to have the least detrimental economic effects.   

I'm sympathetic to the arguments made by folks who continue to oppose mandatory labeling on the premise that our laws shouldn't be stigmatizing biotechnology.  Because a GMO isn't a single "thing" I agree the law is unhelpful insofar as giving consumers useful information about safety or environmental impact.  The law is also a bit hypocritical in terms of exempting some types of GMOs and not others.  One might also rightfully worry about when the government should have the power to compel speech and when it shouldn't.  And, I think we should be worried about laws which potentially hinder innovation in the food sector.  

But, here's the deal.  The Vermont law was soon going into effect anyway. The question wasn't whether a mandatory labeling law was going into effect but rather what kind.   The Vermont law was already starting have some impact in that state and would likely have had nationwide impacts.  Moreover, there didn't seem to be a practical legal or legislative way to prevent the law from going into effect in the foreseeable future.  

The worst economic consequences of mandatory labeling would have come about from those types of labels that were most likely to be perceived by consumers as a "skull and cross bones".   In my mind the current Senate bill avoided this worst case scenario while giving those consumers who really want to know about GMO content a means for making that determination.  That doesn't mean some anti-GMO groups won't use the labels as a way of singling out for protest companies that use foods and ingredients made with the technology, but at least the motives are more transparent in this case.  For some groups it was never about labeling anyway - it was about opposition to the technology.  That, in my opinion, is a much less tenable position, and is one that will hopefully be less successful in the long run.    

Academic Research on USDA Programs

Continuing my discussion from the paper I recently published with the Mercatus Center, I'll share a few thoughts about the academic research on USDA programs.  This is a huge area of research and there is no way I can cover it all, but I'll try to touch the high points.  Underlying citations for all these comments are in the paper.

Farm Payments

Standard economic theory suggests that subsidies, whether subsidies in the form of price supports on crops or subsidies on the premiums for crop insurance, distort production decisions and result in so-called deadweight loss. Subsidies—even supposedly “decoupled” farm payments that aren’t tied to production— can sometimes encourage greater production.

Moreover, economic theory suggests that farmers are not the ultimate beneficiaries of farm subsidies. That seems a bit counter-intuitive.  How can the recipient of a subsidy not benefit from the subsidy?  Well, given an additional subsidy, farmers will compete with one another and bid up the price of fixed assets, such as land or high-quality seed, implying that the owners of fixed assets, such as landowners or holders of patents on seed technology, capture a portion of the subsidy.  There is substantial debate in the academic literature (here is the most recent paper on the topic) regarding the share of farm subsidies captured by nonfarmers, but economists almost universally agree that for every $1 in farm subsidies, farmers benefit by less than $1.

Despite popular claims to the contrary, research suggests that farm subsidies have likely had little to no effect on obesity rates.48 First, although such policies may have had some effect on farm commodity prices, these inputs account for only a small share of the overall retail cost of food.  Second, agricultural policies are mixed, and some policies (such as those for sugar, ethanol promotion, and the Conservation Reserve Program, or CRP) push the prices of agricultural commodities up rather than down. Third, despite the widely varying agricultural policies across countries and over time (see the previous post), those policies do not correlate well with differences in food prices and obesity rates across countries or with changes in obesity rates over time.

Research suggests that the Conservation Reserve Program (CRP) program has achieved some goals related to erosion, wildlife, and soil and water quality, but some unintended consequences have occurred.  Taking some cropland out of production can drive up commodity prices, which in turn incentivizes producers to plant more farmland. This is called a “slippage effect.”  There is also some evidence that CRP payments contribute to higher land prices and thus benefit land owners.

Finally, agricultural policies create distributional effects across producers, locations, and commodities. That is, farm subsidies benefit some farmers more than others and actually harm other farmers and consumers.

Food Assistance Programs

While the original food stamp program had dual goals of farm support (or reducing government surpluses) and reducing food insecurity.  However, little evidence verifies that the modern-day incarnation, SNAP, has any substantive effect on farm prices. For example, I calculate that for every $1 taxpayers spend on SNAP, farmers benefit by only a penny. Likewise, several years ago Martinez and Dixit calculate that food assistance programs increase farm prices by less than 1 percent.  

Since at least the work of the economist Herman Southworth in the 1940s, debate has continued about whether food stamps (now SNAP) have effects that differ from unconditional cash transfers. Southworth noted that people who spend more on food than they receive in food stamp benefits (the so-called inframarginal consumers, who represent the vast majority of SNAP recipients) should, in theory, treat the benefits the same as an unrestricted cash transfer.  The consumer can get around the restriction that SNAP payments be spent only on food by rearranging which items are purchased with SNAP benefits and which are bought with cash. Despite this theoretical result, some empirical evidence indicates that SNAP benefits tend to increase food purchases by a slightly greater amount than would be expected by an equivalent rise in income, though the evidence is debated.

For similar reasons as discussed above, more recent calls to restrict SNAP purchases to only healthy foods or to outlaw purchases of soda or junk food with SNAP benefits are unlikely to be successful; inframarginal consumers can reallocate which items are paid for by SNAP benefits and achieve the same consumption bundle at the same cost, irrespective of the soda or junk food restrictions.

Reasonably good evidence shows that food assistance programs accomplish their primary objective—reducing hunger among low-income Americans. In addition, the best academic research does not support the view that SNAP benefits result in higher rates of obesity (SNAP participation is correlated with obesity, but it probably doesn't cause it).

Agricultural Research

A large body of research has investigated the returns to agricultural research funding disseminating from USDA programs like National Institute of Food and Agriculture. The research tends to show large, positive benefits from public investments in agricultural research.  One review of 35 studies finds that the average estimated rate of return on US public agricultural research is 53 percent, which is quite high compared with other investment alternatives.  In fact, one paper by Julian Alston suggests spending on agricultural research is more beneficial to farmers than farm subsidies.  Despite this, the rate of growth in public spending on agricultural research has slowed over time (though private spending has increased for some crops), a phenomenon some researchers argue is partly to blame for declining rates of productivity growth.  

Farm Subsidies - Magnitudes and Comparisons

Continuing the discussion of the paper I wrote entitled "The Evolving Role of the USDA in
the Food and Agricultural Economy", today I'll discuss some USDA farm support programs (in another post, I'll discuss the academic research on effects of these and other USDA programs). 

In 2012 (the last date of the Census of Ag), the average government payment per farm receiving payments was $9,925. However, a large percentage of farms receive no government payments . In particular, farms that sell less than $50,000 worth of products tend not to receive payments, while the opposite is true for farms with sales greater than $50,000. For the 3.9 percent of farms with sales of $1 million or more, 71.2 percent receive payments averaging $40,559. Whereas the smallest farms receive the smallest average payments in total dollars, they receive the largest payments when expressed relative to value of production. Farms with sales of less than $1,000 that receive payments tend to get 9.36 cents for every dollar of output produced, but farms with sales of more than $1 million that receive payments tend to get only about 2 cents for every dollar of output produced.

Although government payments represent a small fraction of the value of output (i.e., gross revenue), they are certain to represent a much higher fraction of farmers’ net income. In fact, USDA Census of Agriculture data show that in 2012, the average net cash income for each category of farm with sales of less than $24,999 was negative. Those farms operate at a loss; because of this, whatever government payment they receive is infinitely greater than what they
make from farming. The average payment as a percentage of net income (for those receiving payments) is 31 percent, 18 percent, 13 percent, and 7 percent for farms with total sales in the categories $100,000 to $249,999, $250,000 to $499,999, $500,000 to $999,999, and $1 million or more, respectively.

It is interesting to compare all this with SNAP payments.  As indicated, of the farms receiving payments in 2012, the average payment was $9,925. By contrast, USDA data indicate that the average payment per individual receiving SNAP in 2012 was $133 per month, which amounts to $1,596 annually. SNAP payments increase at a decreasing rate with the size of the household. For a four-person household receiving SNAP benefits, the average payment was $440 per month, or $5,280 per year, in 2012. Food assistance programs represent a larger share of the USDA budget than do farm support programs because SNAP recipients far outnumber the recipients of farm program payments, not because each SNAP recipient receives a higher payout than does each recipient of farm supports.

It is also useful to compare US farm support payments with those in other countries.  For this, we can turn to data from a World Bank project led by the Kym Anderson and colleagues. 

The nominal rate of assistance (NRA) is defined as the percentage increase or decrease in gross returns to farmers caused by government policies. A positive number means a country’s
policies are pushing up agricultural prices and returns, and a negative number implies the opposite. The gross rate of assistance (GRA) is the NRA expressed in absolute dollar terms (in the year 2000) instead of in percentage terms. The GRA is the NRA multiplied by the value of agricultural production in a country divided by the number of farmers.

Figure 14 shows the average NRA, and figure 15 shows the average GRA of 53 different countries from 2000 to 2010. The figures contain a selection of developed and developing countries to provide insight into the diversity of agricultural policies around the world. The United States had an average NRA of 11.2 percent and a GRA of $3,576 per farmer over this period. That means that the gross returns of US farmers are 11.2 percent (or $3,576 per farmer) higher than would have been the case were it not for various government policies. Some countries, such as Norway, Iceland, Switzerland, and the Republic of Korea, have NRAs higher than 100 percent. Thus, US agricultural policies push farmer prices and returns higher than would be the case in the absence of such policies, but by an amount far less than is the case in some other countries and far more than in others.

Whereas figure 15 shows a snapshot of the GRA at a point in time, figure 16 shows changes in the GRA per farmer over time in eight selected locations (all in 2000 dollars). The GRA per farmer in the United States increased sharply from the 1970s to the 1980s and has subsequently stayed around $3,000 per farmer per year. The GRA per farmer in Japan has risen over the entire period considered from only $536 per farmer per year in the 1960s to $8,653 per farmer per year from 2000 to 2009. New Zealand dramatically lowered the GRA per farmer from the 1980s to the 1990s. Brazil and China have policies that are relatively neutral with regard to farmer gross returns. Until recently, countries in the European Union had highly distorting policies equivalent to taxes in excess of 100 percent.

In most locations (except eastern Europe and central Asia), agricultural policies have distorted the overall economy less since the 1980s. From 2000 to 2010, the United States had a welfare reduction index (WRI) of 17; the only locations that had less distorting policies were Australia and New Zealand, which had an average index of only 3.8 over this period (figure 17).

The welfare reduction index (WRI)  accounts not only for transfers but also for trade policies that affect the food and agricultural economy. According to Anderson, Rausser, and Swinnen, the WRI is calculated as “the percentage uniform trade tax which, if applied equally to all agricultural tradables, would generate the same reduction in national economic welfare as the actual intrasectoral structure of distortions to domestic prices of these tradable goods.”

The previous graphs aggregate the effects of agricultural and trade policies across all commodities. Figure 18 shows the average NRA for 11 different commodities in the United States from 2000 to 2010. During that period, sugar, cotton, and milk producers benefited most, with NRAs of 75 percent, 56 percent, and 39 percent, respectively. Barley and wheat had relatively low NRAs. Other commodities like beef and pork (not shown in the graph) had NRAs near zero.

To put these figures in perspective, it is useful to compare them with other distortions in the economy. In a remarkable statement, Anderson, Rausser, and Swinnen write,

In 2004, existing agricultural and trade policies accounted for an estimated 70 percent of the global welfare cost of all merchandise trade distortions, even though the agricultural sector contributes only 6 percent of global trade and 3 percent of global GDP.

In short, despite the small contribution of agriculture to global GDP, agricultural policies are responsible for the lion’s share of welfare losses that result from trade distorting policies.


In the paper I also talked about the fact that USDA impacts on the economy likely extend beyond those caused by explicit farm-commodity policies. To get a sense of such impacts, I utilized the RegData database.  You can read the paper for more details on that data set, or look at some of the work by Levi Russel who blogs at FarmerHayek.com.