Blog

Can a sustainability facts label reduce the halo surrounding organic labels?

A couple years ago I wrote a post about a hypothetical sustainability facts label that is analogous to exiting the nutrition facts panels. In that post, I conjectured that a sustainability facts panel might help alleviate some of the misperceptions some consumers have with regard to various labeling claims. Turns out Sofia Villas-Boas at Berkeley and Zack Neuhofer, a PhD student working with me at Purdue, were simultaneously having similar ideas. As such, we teamed up to test some of these conjectures.

The result is a new paper forthcoming in Applied Economics Perspectives and Policy. Here’s the abstract.
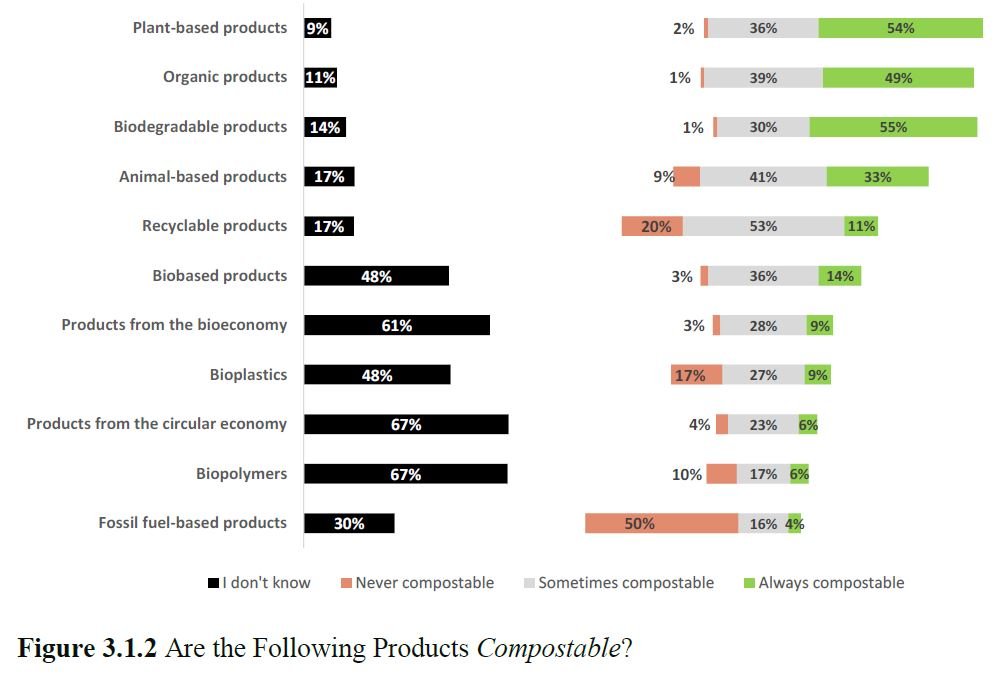
Consumers often form beliefs about credence attributes unsupported by the best available evidence. In particular, prior research has revealed many consumers have overly-optimistic beliefs about the environmental and nutritional impacts of organic food. We propose and study the effects of a sustainability facts label (SFL), which displays quantitative environmental information related to global warming potential, land use, and energy use per serving size of the product. The SFL is akin to a nutrition facts label (NFL), which we also study. We surveyed a nationally representative sample of milk consumers in the United States (USA) to measure their choices and beliefs about organic vs. conventional milk under one of three different label information treatments; the NFL only, the SFL only, and both labels relative to a control without any nutrition or sustainability information. Unexpectedly, our results show that the SFL increased the likelihood of organic purchases. Facts panels altered beliefs; The participants exposed to the SFL increased their perception that organic performs better on environmental metrics, despite the fact the information contained in the label provided a nuanced picture with organic better in some dimensions and worse in others. Consistent with the information provided, consumers exposed to the NFL decreased their perception that organic had fewer calories and more protein than conventional milk. Prior beliefs about organic were found to be important determinants of choice and information acquisition.

Kudos to Zack who did the heavy lifting on this project. As it turns out, we didn’t find much support for the original conjecture but instead found a more complex and nuanced set of reactions to “objective” sustainability labels.

Public Understanding of and Attitudes Toward Bio-Based Labels and Claims

I recently completed a new study for the Plant Based Product Council exploring consumer understanding and attitudes toward bio-based labels and claims.

Given the lack of harmonization and potential public confusion around terms used to describe the bioeconomy, a survey was designed to to determine consumer knowledge, beliefs, and preferences for the following 10 terms: biobased, biodegradable, bioeconomy, bioplastics, biopolymer, circular economy, compostable, organic, plant-based, and recyclable. I conducted a nationwide survey of about 1,500 U.S. residents to explore these issues (note: topline results reporting the share of respondents falling in every response category for every question asked in the survey is provided here).

Here are some of the key findings:

  • Self-assessed, subjective knowledge of bio-based related terms is low. About half the public has never heard the terms biopolymer, circular economy, or bioeconomy; more than half have either not heard or indicate not knowing the meaning of the terms biobased and bioplastics. By contrast, a majority of respondents said they were either somewhat or very knowledgeable of the terms: recyclable, organic, plant-based, biodegradable, and compostable.

  • Generally, respondents indicated ignorance in knowing whether products that were biopolymers, bioplastic, biobased, or from the circular economy or bioeconomy were or could be recyclable, compostable, or organic.

  • Responses to true/false and definition-matching questions reveal wide dispersion across the public in objective knowledge of bio-based and related terms. Only 0.6% of respondents answered 90% or more of the questions correctly. Forty six percent of respondents answered more questions incorrectly than correctly, and another 11% answered as many questing right as wrong. For example, only 27% of respondents correctly indicated it was false that “All biodegradable products are compostable.”

  • More respondents than not provided incorrect definitions for biodegradable, compostable, organic, and biobased. Respondents were particularly likely to mistake the definition of biodegradable for composable, biobased for organic, and plant-based for biobased. White, non-Hispanics, middle-aged, higher educated individuals, particularly those with graduate degrees, exhibited higher objective knowledge of biobased and related terms, on average, than non-white, young, elderly, or people whose highest education was a high school degree.

  • Compostable, plant-based, organic, biodegradable, and recyclable products were perceived to be high in sustainability and environmental friendliness; the opposite was true of animal-based and especially fossil-fuel based products. Recyclable and compostable products were viewed as relatively affordable whereas organic products were not. Recyclable products were perceived as relatively low in quality whereas organic was perceived as high quality.

  • Perceptually, respondents tend to view terms like organic and plant-based as being highly similar and related to another grouping of perceptually similar terms: biodegradable, compostable, and recyclable. Perceptually, respondents view all other terms with a “bio” prefix similarly: biobased, biopolymer, bioplastic, bioeconomy. Terms viewed as most dissimilar to the rest include circular economy, fossil-fuel based, and animal-based.

  • Simulated shopping choices indicate respondents are willing to pay significant premiums for take-away food in compostable, plant-based, or recyclable packaging while placing discounts on biobased and bioplastic packaging. Preferences for plant-based, compostable, and bio-based packaging are heavily influenced by the presence/absence of other label/claims, indicating consumers view these terms as having strong complementarity or substitutability relationships with other labels/claims.

  • Choices are significantly impacted by disclosures providing definitions of label terms. Providing definitional disclosures increased willingness-to-pay and choice likelihood for compostable packaging while having the opposite effect for biodegradable packaging, at least when these labels appeared in isolation.

  • Providing definitional information tends to reduce the size of the preference interactions between labels. When packaging already contains many competing claims/labels, provision of information disclosures increases the value of adding a new biobased claim in all instances. However, when adding a single label/claim in the absence of any others, definitional information reduces willingness-to-pay and choice probability for four terms (biodegradable, recyclable, plant-based, and biobased) while increasing it for two terms (bioplastic and compostable). These findings indicate definitional information tends to cause respondents to be more likely to

You can read the whole report here.

Sustainability Facts Panel

Yesterday, Chipotle announced a new advertising campaign called “Real Foodprint.” As the video below shows, a new app reports on a number of environmental metrics (carbon, water, soil) for different Chipotle meals compared to “conventional” ingredients.

Without knowing much about their measurement approach, I am skeptical of Chipotle’s particular claims (for example, much of the research shows avoiding GMOs, hormones, or going organic increases carbon emissions, water use, etc. per unit of food produced). However, I like the overall idea of try trying to provide more objective/quantitative measures on sustainability.

A problem in our current market environment is that various labels (humane, “all natural” non-GM verified, organic, local) are (often incorrectly) interpreted by consumers to imply products are generally safer, healthier, or better for the environment than much of the research would suggest.

Probably one of my favorite opening lines of an academic paper is by Jonathon Schuldt and Norbert Schwarz entitled “The “organic” path to obesity? Organic claims influence calorie judgments and exercise recommendations”:

organic_bias.JPG

The point isn’t to pick on organic but simply to say that many labels and claims (and, well frankly a lot of marketing) can promote false beliefs (e.g., see this recent paper on redundant labels with Lacey Wilson). One way to try to counteract that is to try to provide more “objective” information. Most food products already carry this sort of information in the form of the Nutrition Facts Panel.

NFP.JPG

What if this approach was broadened to also include sustainability-related outcomes? Either a “sustainability facts panel” or a broadened “food facts panel.”

foodfactspanel.JPG

Such an approach would be more credible if monitored by a third party (rather than one company’s claims) and communicated in a form that was easily comparable across foods and brands. One hypotheses is that such “sustainability facts panels” might lessen the chance for “false beliefs” and “health halos” to emerge with more nondescript labels ; we currently have research planned to address this very question.

Conceptually, I like the idea of outcome-based reporting and labeling. However, there are a number of empirical challenges. I wrote about some of them back in 2015.

In principle, it is possible to imagine something like a nutrition facts panel for environmental issues. However, the two are not as analogous as might first appear. First, scientists have a pretty good idea how to measure the fat, carb, and protein contents of food, whereas measuring C02 or deforestation impacts is tricky business with a lot of uncertainty. Moreover, the nutritional content of a processed food is relatively stable regardless of where the raw ingredients came from, which plant or facility was used to manufacture it, how it got to the store, or how you transported and cooked it. None of this would be true for an environmental label, which would require more more extensive (and more costly) monitoring and tracing, and if it is at all accurate, one could have two Wheaties boxes that are nutritionally equivalent but with very different environmental impacts. That may be all the more reason to inform consumers, but the point I’m trying to emphasize here is the much higher cost and greater uncertainty in informing about nutrition vs the environment.

As the science on these issues progresses, and as more digital information is collected on farms and transmitted up the supply chain, the likelihood of developing more uniform, credible sustainability facts panels increases.

Consumer Demand for Redundant Food Labels

That’s the title of a new working paper co-authored with Lacey Wilson. Here is the abstract:

Previous studies, as well as market sales data, show some consumers are willing to pay a premium for redundant or superfluous food labels that carry no additional information for the informed consumer. Some advocacy groups have argued that the use of such redundant labels is misleading or unethical. To determine whether premiums for redundant labels stem from misunderstanding or other factors, this study seeks to determine whether greater knowledge of the claims - in the form of expertise in food production and scientific literacy - decreases willingness to pay for redundant labels. We also explore whether de-biasing information influences consumers’ valuations of redundant labels. An online survey of 1,122 U.S. consumers elicited preferences for three redundantly labeled products: non-GMO sea salt, gluten-free orange juice, and no-hormone-added chicken breast. Respondents with farm experience report lower premiums for non-GMO salt and no-hormone-added chicken. Those with higher scientific literacy state lower premiums for gluten-free orange juice. However, after providing information about the redundancy of the claims, less than half of respondents who were initially willing to pay extra for the label are convinced otherwise. Over 30% of respondents counter-intuitively increase their premiums, behavior that is associated with less a priori scientific knowledge. The likelihood of “overpricing” redundant labels is associated with willingness-to-pay premiums for organic food, suggesting at least some of the premium for organic is a result of misinformation.

The figure below shows a key result. People place a $0 premium on non-GMO salt, gluten-free orange juice, and hormone-free chicken have significantly higher scientific literacy scores than people who place positive or negative premiums on these redundantly labeled products.

redundantlabels.JPG

My State is Better than Yours: Competition between State Food Branding Programs

The journal Agribusiness just released a new paper I co-authored with Clint Neill and Rodney Holcomb. The work was motivated by the observation that every state in the U.S. has an agricultural marketing program aimed at promoting foods from their state. Examples include the “Taste NY” and “Pride of New York” programs as well as “Go Texan” and “California Grown.”

Our questions were two fold: 1) How much do consumers value products labeled with their state’s logo relative to other states’ products, and 2) what are the implications for state marketing programs?

We surveyed 6,900 consumers in an eight‐state contiguous region. For our application, we chose milk, and asked people which of several milk products with different state logos (and a regional or national brand) they preferred at different prices.

Not surprisingly, we find that consumers prefer products with their own state’s logo. For example, Texans’ average willingness-to-pay (WTP) for Texas milk is $4.14/gallon, but Texans’ value for milk from bordering states, New Mexico, Oklahoma, and Arkansas only averaged $1.82, $2.65, and $2.72/gallon, respectively. There are a number of interesting patterns. Here’s an excerpt from the text:

While each state’s consumers tend to prefer their own label and have a distinct order of preference for other states, the asymmetry between states is less clear. For example, Oklahoma consumers are willing to pay $2.84 for the Texas label but Texas consumers are only willing to pay $2.65 for the Oklahoma label, so there is an asymmetry of $2.84−$2.65 = $0.19. Thus, Oklahomans value the Texas label $0.19 more than Texans value the Oklahoma label.

Table 5 shows this type of asymmetry for all combinations. Interestingly, every other state’s consumers value the Colorado label more than Colorado consumers value other states’ labels. Alternatively, New Mexico consumers value all other state brands more than the other states’ consumers value the New Mexico label.

While it is perhaps obvious that people in a state will tend to prefer their own products, it is also important to note that people have some value from agricultural products from other states (and, in fact, some small share of people prefer products from another state). The result is that state branding programs “steal” consumers from other states (the effect is a bit like the prisoner’s dilemma problem). The state branding program looks great if your the only state that has the program, but if all states have their own programs, the effects partially serve to cancel each other out. Here’s what we write about this so-called “beggar thy neighbor” effects:

In the case of market shares, we were able to illustrate the large decreases as a group of producers from one state starts with having no state branded competitors to competing against several other brands within a region. Producers, ideally, would have a higher return if they were the only ones with a state label, but the optimal strategy for all agents in the region is to utilize a state label. Thus, the potential beggar‐thy‐neighbor scenario is possibly a Nash equilibrium. Furthermore, states who market their brand outside their borders are shown to have increased total market share

For example, below is a graph showing what happens to demand for milk with a “Made in Oklahoma” label when no other states label their product (the green line with triangle markers) relative to what happens to demand for “Make in Oklahoma” milk when other states introduce their own labels (the red and blue lines). As the figure below shows, the market share more than halves when one state’s label has to compete with all the others in a region.

beggarneighbor.JPG

One potential solution (at least from the producer’s perspective) we discuss is for groups of states to band together and use a regional label.