Blog

The Problem of Food Waste Over-stated?

Marc Bellemare and colleagues at the University of Minnesota have an important new paper out on food waste.

First, they note that there are important weaknesses and inconsistencies in the leading definitions of food waste published by the United Nations, the USDA, and the European Union.  Second, they provide compelling conceptual reasons to suggest that reported measures of food waste are almost certainly overstated.  Finally, they propose a conceptual logically-consistent approach to measure food waste.  

The arguments for why the value of food waste is overstated boil down to two factors: 1) some "waste" has productive uses as animal feed, compost, etc. and 2) the value of wasted food is often "priced" at the retail level, when in fact the actual waste occurs further upstream the supply chain where commodity prices are lower.  

You can read the whole paper here.

Purdue

I am pleased to announce that I have officially accepted an offer to be the next Head of the Department of Agricultural Economics at Purdue University (I will also be nominated for the post of Distinguished Professor at Purdue) and will begin there after the first of July.

I have thoroughly enjoyed my 12 years at Oklahoma State and appreciate the support and opportunities OSU has afforded me. I've had great students and colleagues, and have made wonderful friends in Stillwater.  But, now’s the time to move on to a new challenge.  

The college of agriculture at Purdue is routinely ranked in the top 5 to 10 worldwide, and the Department of Agricultural Economics has a long history of excellence and leadership in the profession.  It's a large department with about 50 faculty members, almost 150 graduate students, and 600 undergraduates.  It's a big job and I'm looking forward to it.  

What kind of farmer are you?

A couple days ago, I reported the results from the Food Demand Survey (FooDS) for March 2017. In addition to a typical question we ask every month "Have you ever worked on a farm or ranch?", we added a new follow up question, "Which of the following best describes the kind of farm you worked on? (Check all that apply)."

As I reported then, about 17% of people said yes to the first question.  Of this 17%, about 38% followed it up by saying the type of farm was a "garden in your backyard", 23% said "A chicken coop in your backyard" and 12% said "a community garden".  I received some Twitter questions and reaction to the results.  

Here's one vein of reaction:

Of course, this is exactly what we wanted to know: who are the people checking "yes" to this question and what do they (not us) consider farm or ranch work? 

A more substantive question was this one:

The answer is "yes".  This was a "check all that apply" question and a lot of commodity crop and livestock farms also have backyard gardens and chickens.  To get at this issue more directly, I went back to the data and looked at the 17% who said "yes" they had worked on a farm and ranch and looked at the percent of respondents who said they had a backyard garden (or chicken coop or community garden) but did NOT check “A farm that produces commodity crops (e.g. corn, wheat, soybeans, cotton, or rice)” or “A farm that produces commercial livestock (e.g. cattle, swine, or poultry).” 

Here are the results: of the 17% who said they'd worked on a farm or ranch: 4.7% indicated working in a community garden but NOT a commodity crop or livestock operation, 12.2% indicated they worked in a garden in their backyard but NOT in commodity crop or livestock operation, and 7.5% said they had a chicken coop in their backyard but had NOT worked in a commodity crop or livestock operation.  

Food Demand Survey (FooDS) - March 2017

The March 2017 edition of the Food Demand Survey (FooDS) is now out.

Some items from the regular tracking portion of the survey:

  • Willingness-to-pay (WTP) decreased for steak, pork chops, and especially deli ham. WTP increased for chicken breast, hamburger, and chicken wings. WTPs for all meat products are lower than one year ago, except for hamburger.
  • Consumers expect higher beef, chicken, and pork prices compared to one month ago. Consumers plan to buy slightly less chicken and beef compared to last month.
  • The largest percentage increase in concern was for bird flu and the largest decrease in concern was for farm animal welfare.

Several new ad hoc questions were added to this month’s survey that mainly dealt with knowledge of farm production practices.

Participants were first asked: “Have you ever worked on a farm or ranch?”. About 17% of participants answered “yes.” Participants who answered “yes” were then asked “which of the following best describes the kind of farm you worked on?” Respondents were provided with six options and they could check all that applied.

Of the 17% who said they had worked on a farm, 43% checked “A farm that produces commodity crops (e.g. corn, wheat, soybeans, cotton, or rice)” followed by 40% who checked “A farm that produces commercial livestock (e.g. cattle, swine, or poultry).” “A garden in your backyard” was picked by 38% and “A chicken coop in your backyard” was picked by 23%. 20% checked “other” (and provided responses such as working on a dairy farm or a horse farm or on school farms such as FFA), and 12% checked “A community garden”.

Secondly, participants were asked: "Which of the following animal production industries use added growth hormones?” Over half of participants stated that believed beef, pork, poultry and dairy industries use added growth hormones. Over 75% of participants indicated that they thought that the beef cattle industry uses added growth hormones. Over half of the respondents stated they believe the swine and poultry industries to uses added growth hormones. In reality, the swine and poultry industries do not use any added growth hormones. About 57% of participants stated they believed added growth hormones are used in the dairy industry.

Third, participants were asked: “What percentage of dairy cattle in the U.S. are treated with rBGH?” Overall participants perceive a much greater use of rBGH in dairy cattle than what is actually used. About 20% of participants believe that 50-59% of dairy cattle are treated with rBGH. 5.7% believe that 90- 100% of dairy cattle are treated with rBGH. Only, 10.9% of participants stated that less than 10% of dairy cattle are treated with rBGH. In reality, less than ten percent of all dairy cattle in the U.S. are treated with rBGH.

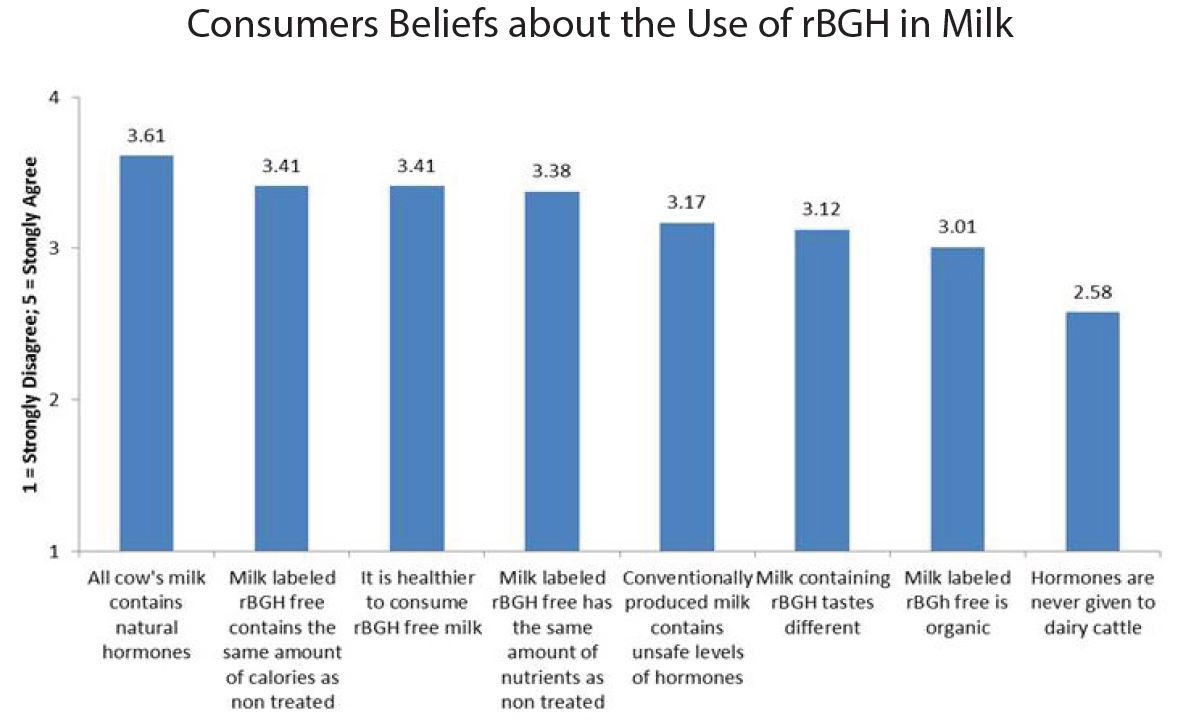
Lastly, participants were asked: “To what extent do you agree or disagree with the following statements?” Individuals responded on a 5-point scale: 1=strongly disagree, 2=somewhat disagree, 3=neither agree nor disagree, 4=somewhat agree, 5=strongly agree.

The most common answer for each item was “neither agree nor disagree”, except for the statement all milk contains natural hormones where the most common answer was “somewhat agree”. The statement “all cow’s milk contains natural hormones” was agreed upon most, whereas the statement “hormones are never given to dairy cattle” was agreed upon least.
About 38% of participants answered “somewhat agree” or “strongly agree” that it is healthier to consume milk labeled rBGH free. Approximately 30% of participants answered “somewhat agree or “strongly agree” that conventionally produced milk contains unsafe levels of hormones. Only 5.6% of participants selected “strongly disagree” that milk containing rBGH tastes different.

Why the rise in demand for chicken?

Last month I discussed the ways economists attempt to study changes in beef demand.   Over at meatingplace.com, Mack Graves delves into the issue and questions why chicken demand has risen at a faster pace over the past several decades compared to beef.  He writes.

A recent study of beef demand by Glynn Tonsor and Ted Schroeder of Kansas State University published on Feb. 3, 2017 showed beef demand rising from an index of 75 (1990 = 100) in 2010 to 93 in 2015. That’s a gain of 18 points in five years! However, the 75 index in 2010 was the lowest value in the 25 year period.

For some perspective, the chicken demand index rose from slightly more than 100 in January of 2011 to about 112 in October of 2016 although it had reached a high of 128 in late 2015.

Graves' diagnosis as to why chicken demand has fared better than beef demand?

Analyzing chicken’s success starts with one word—fat. There is no question that the science community with its study after study deploring the saturated fat in beef was a kick starter for chicken consumption. All the fast food chains jumped on this bandwagon led by McDonald’s with their chicken McNuggets.

I suspect he's partially right.  Fat concerns probably explain part of the decline in the 1980s and early 1990s.  But, there is another major part of the story: relative prices.  

If beef and chicken are demand substitutes, then a fall in the the price of chicken will cause people to substitute away from beef toward the lower priced chicken.  This will result in a fall in the beef demand index (or at least make the index smaller than it would have been otherwise). 

So, what's happened to the retail price of chicken compared to beef since the 1970's?  Here's the retail price of beef divided by the price of chicken according to USDA data.

In the early 1970's, a pound of beef was about 2.5 times more expensive than a pound of chicken, and this figure trended upward over time.  Today, beef is over 4 times more expensive than chicken.

The lesson here is that increased efficiency of chicken production, resulting in lower relative chicken prices, has led to an increase in chicken consumption and reduction in beef demand.