I was recently made aware of the so-called Restaurant Performance Index (RPI) put out by the National Restaurant Association (NRA). According to their website:
“The RPI is based on the responses to the National Restaurant Association’s Restaurant Industry Tracking Survey, which is fielded monthly among more than 400 restaurant operators nationwide on a variety of indicators including sales, traffic, labor and capital expenditures. Restaurant operators interested in participating in the tracking survey”
and
“Index values above 100 indicate that key industry indicators are in a period of expansion, while index values below 100 represent a period of contraction for key industry indicators. The Index consists of two components – the Current Situation Index, which measures current trends in four industry indicators (same-store sales, traffic, labor and capital expenditures), and the Expectations Index, which measures restaurant operators’ six-month outlook for four industry indicators (same-store sales, employees, capital expenditures and business conditions).”
I was a bit curious. How well do some of the variables I'm tracking in my Food Demand Survey (FooDS) follow the NRA's RPI? By looking back at past releases, I was able pull together monthly data on the overall RPI, the current situation index, and the expectations index, and I merged these with data from FooDS on average reported spending on food away from home and changes in anticipated spending on food away from home each month.
First, the good news. Spending on food away from home (as measured by FooDS) seems to track closely with the RPI-current situation index.

It probably isn't too surprising that the two are positive correlated since two of the measures of the RPI-current situation index are same store sales and traffic volume; however, it is still comforting to see my FooDS data roughly track this measure from the NRI. One benefit of FooDS is that we release the data in a more timely manner. Right now, the latest figures available from the National Restaurant Association (NRA) are for March. However, I already have a measure of April's away from home food expenditures from FooDS (it's $55.43). A simple linear regression predicts that NRA's current situation index will be 102.3 for April. We're already fielding May's FooDS right now, so I can make an even more up-to-date forecast in a few days.
Now, the not-so-good news. In FooDS, we track consumers' stated intentions to increase or decrease spending on food away from home in the following weeks. One "anomaly" present in the FooDS data is that, every month, people say they plan to spend less on food away from home next month. Over the three years we've been doing FooDS, the measure ranges from a -2.4% cutback in spending to a -1.05% cutback in spending (average is -1.59%). I interpret this as people feeling guilty about spending on food away from home, and perhaps even evidence of a self-control problem: people plan to cut back on eating out but rarely actually do. In any event, despite this "bias", trends in this variable might still be useful as there are some months people plan to cut back more than others.
Here's a plot of the planned spending change on food away from home from FooDS alongside the expectations portion of the NRA's Restaurant Performance Index:
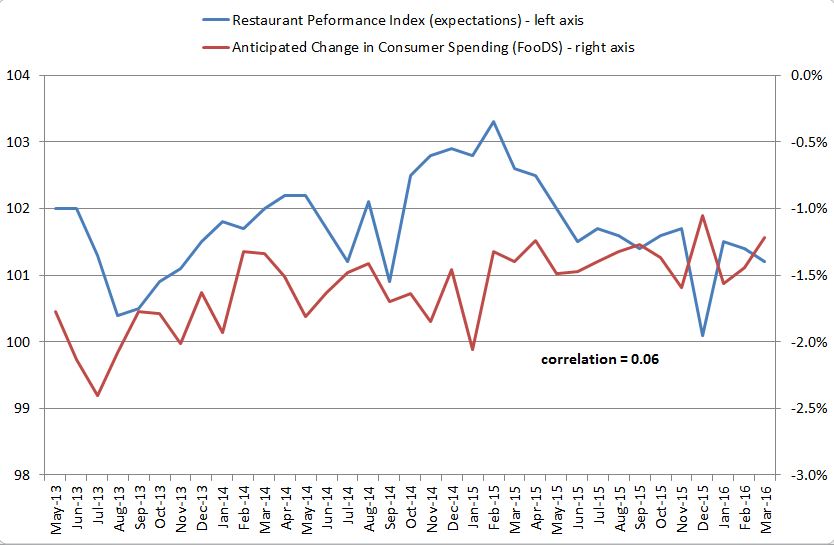
While the correlation between the two is positive, it is pretty weak. The two track each other pretty closely through about mid 2014 and then start moving in opposite directions. The two measures are getting at slightly different things. One is measuring how restaurant owners/managers are planning to change capital expenditures, staffing, and what they think sales will be in the future; the other is a measure of how much consumers think they'll change spending. Maybe all this says is that restaurant operators' expectations are not the same as restaurant consumers' expectations.
So, here's a little test. How well do restaurant owner's expectations this month correlate with their own "acutal" (or current performance index) the following month? The correlation between the lagged NRA expectation index and the current period NRA current situation index is 0.35. O.k., so there is some accuracy associated with the NRA's expectation index.
Now, let's do the same thing with the FooDS data. How well do consumers' expected spending changes this month correlate with their own "acutal" food away from spending next month? The correlation between the two is 0.68. So, despite the fact consumers' expectations are downwardly biased as discussed above, changes in their expectations seem quite predictive of next month's spending on food away from home.
So, it seems consumers (in aggregate) know their own futures a bit better than restaurant operators know theirs.