In economics, it's tough to separate correlation from causation because the world is a messy place with lots of things changing at the same time. As a result, empirical economists are always on the lookout for natural experiments, or situations where there was some random, unanticipated "shock" to the market that can help us get closer to an experimental setting, where we know a change in X was not due to a change in Y.
I was reading through the latest edition of Meatingplace magazine, and was surprised to see a story about an event that provides precisely the sort of unplanned "shock" that we are always looking for. In particular, about eight years, ago, the USDA started using cameras (rather than people) to determine meat quality. The two main quality grades are Choice (more marbled (or fattier), higher quality) and Select (leaner, lower quality).
Apparently in June 2017, the USDA issued an update to USDA's camera grading system that "appeared to inaccurately assess the degree of marbling on some carcasses - allegedly grading some Choice that should have been Select." The USDA issued a new update to the cameras in October in 2017 to correct the problem. One analysis, quoted in the article, estimates that about 12,000 cattle were inadvertently graded Choice rather than Select (a 2.4% increase according to the article, if I'm reading it right).
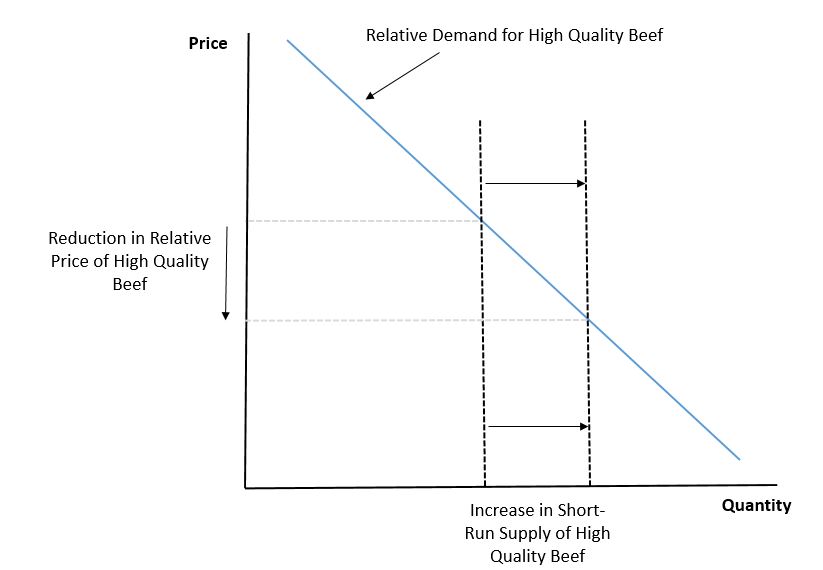
So, we have an unplanned, unanticipated "shock" to the beef quality market that shifted the supply of high quality meat and reduced the supply of lower quality meat. This is illustrated by the two vertical lines in the figure (the lines are vertical because the supply is fixed in the short-run: you can't take Choice carcass and turn it into a Select one once the animal has been removed from feed). If demand curve slopes downward, then this unanticipated increase in supply of Choice (and reduction in Select) quantity, should reduce the price premium for Choice over Select. And in-fact, because the shock to supply is completely exogenous (it had nothing to do with demand but with a camera update), we should be able to use the natural experiment to estimate the slope of the relative demand curve for high quality beef (or the so-called elasticity of demand).
Here is data from the USDA on the difference in price between Choice and Select beef, or the so-called Choice-to-Select spread, over the time period of interest (in particular, this is the difference in boxed beef cutout values measured in dollars per hundredweight - or cents per pound).
Just as one would expect, the increase supply of Choice relative to Select led to a reduction in the price premium charged for Choice relative to Select. Of course, these raw data might be misleading - what if there is a seasonal pattern in which the Choice-to-Select spread falls every year from June to October? To address this concern, I downloaded the last 10 years of data on the Choice-to-Select spread and found that the observed Choice-to-Select spread from mid June to late October in 2017 was $4.34/cwt lower than would be expected even after controlling for seasonality (month of the year), year, and a time trend. This works out to about a 31% lower Choice-to-Select spread than would have expected during this time had it not been for the grading camera update (assuming there aren't other confounds I'm not controlling for).
So, good news, it appears, the demand curves do indeed slope downward. We can also go further if we take the aforementioned 2.4% change in quantity at face value that came from the Meatingplace article. The price flexibility of demand (this is roughly the inverse of the elasticity of demand) for Choice (relative to Select) is given by the percent change in price over quantity, or -31%/2.4% = -12.9%. So for every 1% increase in the quantity of Choice vs. Select supplied, there is a 12.9% reduction in the Choice-to-Select price spread.

