Blog

How people cognitively group different foods

I ran across this interesting ethnographic study of how people conceptualize different foods. It’s a small sample of only 27 people, so one might take the results with a grain of salt, but nonetheless, I found the following figure interesting. The results are from a “pile sorting” exercise where people were asked to group 42 different foods in terms of their similarity to one another in as many groups as they wanted.

Source: Fox, E.L., Davis, C., Downs, S.M., McLaren, R. and Fanzo, J., 2021. A focused ethnographic study on the role of health and sustainability in food choice decisions. Appetite, p.105319.

Source: Fox, E.L., Davis, C., Downs, S.M., McLaren, R. and Fanzo, J., 2021. A focused ethnographic study on the role of health and sustainability in food choice decisions. Appetite, p.105319.

I thought it was interesting that plant-based burgers and milk were neither classified as “meat” or “dairy” or “plant” but in categories of their own; by contrast the in-vitro meat burger was closer to the meat category.

They also found that:

the most salient considerations cited by our participants were price, health, taste, and time.

These findings are consistent with the broad literature on food values; I should note that we have published several papers in the past where we asked larger samples of consumers to rate and rank different foods along multiple dimensions (e.g., here, here, or here)

The Ebbs and Flows of Fashionable Food

A recent article in Forbes ran under the headline “Regenerative Agriculture: The Next Trend In Food Retailing.” It appears regenerative is a trend that is taking a while to get going. Here is my comment on an article in the New York Times from almost exactly one year ago today.

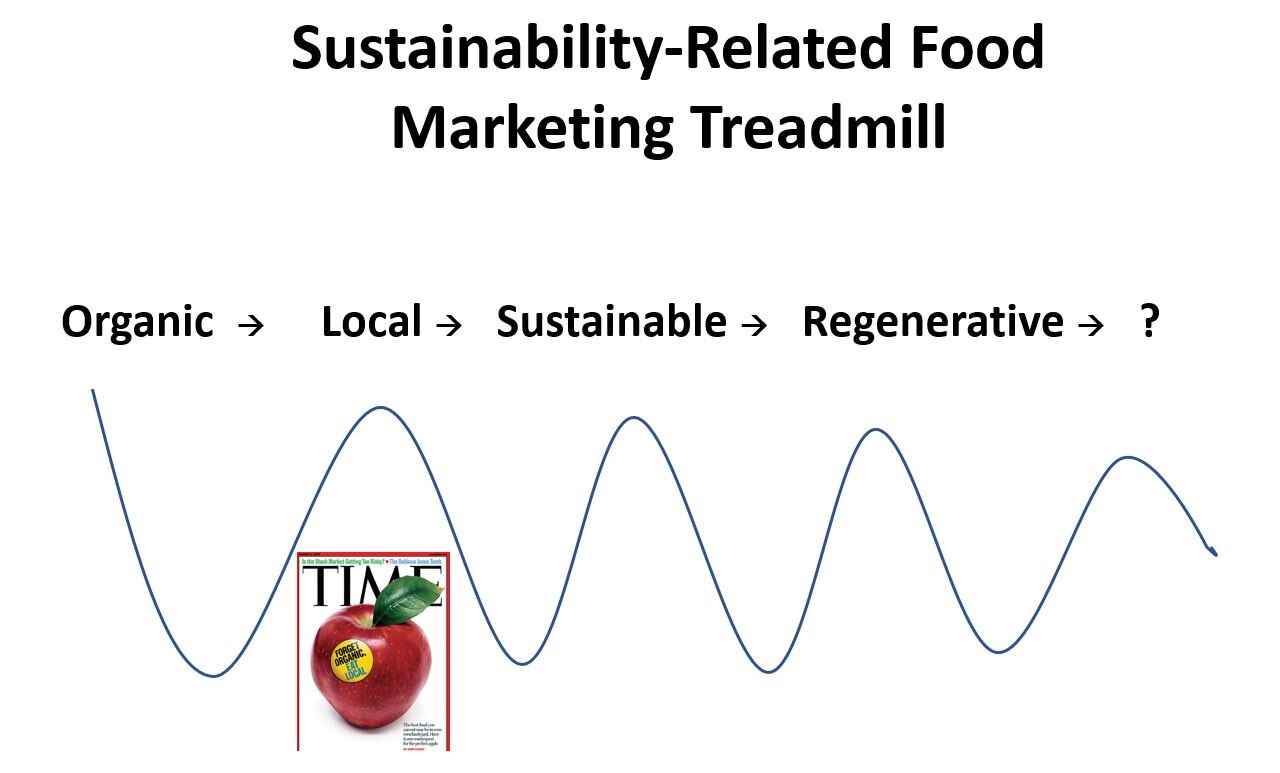
As shown in the figure below - taken from a presentation I gave about a month ago - Time Magazine had a cover image that said “Forget Organic. Eat Local” back on 2007. We subsequently seemed to move from local to sustainable. Now it’s regenerative. Next, it will be something else.

What causes the rise and fall, or rather the rise and plateau, of various food marketing claims?

treadmill.JPG

None of these movements would have any traction if there wasn’t at least some underlying demand from consumers and investors for lowering the environmental impacts of food production, improving our health, giving farm animals a desirable life, or improving incomes of small farmers. That these base concerns exist provides the context for new movements to make their case for a place on dinner plates. Given that background context, upswings of food movements are driven the following factors.

  • Desire for authenticity and trustworthiness,

  • Myth making and seeking (“silver bullet” solutions that solve all the food system ills - environment, health, food security, and otherwise - seem particularly persuasive),

  • Romanticism of the small and natural,

  • Status-seeking (food as fashion), and

  • A core of committee devotees who are able to garner institutional support for the movement.

At some point, these movements lose their luster and become blasé. It’s not that the movement “dies” (e.g., organic food still appears to be experiencing strong sales growth), but rather the movements eventually lose their moral force and cultural cache. Why?

Here are a few thoughts.

  • As a movement grows, there is a need for standardization. What, exactly, is “local”? Food grown in your same state? Or region? Within 100 miles? Or 50 miles? What is “regenerative”? I still don’t know the answer to the last one. In the case of organic, competing definitions and conflicting standards ultimately led to U.S. federal standards and a certification program in 2002. While certification helps improve transparency and consumer communication, choices made in the process can alienate “true believers.” Consider, for example, the contentious issue of whether hydroponic crops can obtain an organic certification. Whatever decision the USDA made on that question (and countless others) was going to create winners and losers, with some people arguing that the movement has lost it’s way to gain mainstream appeal.

  • Corporatization and greenwashing. When these movements are small and growing and attracting consumers, the profits generated attract new entrants and competition, which eventually include “Big Food” and “Big Ag.” Large players can bring new knowledge, economies of scale, and open marketing channels, which helps bring down cost and helps the movement grow. However, many of these food movements are premised on the appeal to “natural” and “small,” and in many ways the movement ideology is often antithetical to scale. The very things that need to happen to mainstream a movement undermine credibility among a certain set of movement promoters.

  • Science evolves. When a movement is new and undefined, as “regenerative” is at the moment, it is easy to attach to it all of one’s hopes and dreams of food system reform. But, as the movement becomes more defined and standardized, scientists begin to conduct studies and find that the world is complex and nuanced. Studies find, for example, that organic food isn’t substantively more nutritious than conventionally produced food; and, that while organic uses fewer synthetic pesticides it also has lower yields and thus requires more land to produce the same amount of food. Studies find that localness of food has little relationship with greenhouse gas emissions. And so on. A movement loses some of its luster when it isn’t a silver bullet.

  • Mainstreaming removes prestige. When everyone can have organic food, it is no longer cool to eat organic food. Part of the appeal of high-end fashion, in both clothes and food, is exclusivity. The high price point helps these products maintain their position as status symbols, but as standardization, corporatization, competition, and scale economies come about, prices often fall. For some people, and for some goods, this can lead to a type of Veblen Good Effect, where demand falls as prices fall because the good loses its position as a status symbol.

It’s unlikely we’ll ever reach a point where there aren’t ebbs and flows in sustainability-related food trends, but there may be some ways to potentially partially step off the treadmill. One possibility is to move toward more outcome-oriented and objective (rather than process-focused, subjective) sustainability labels. That said, the advent of nutrition fact panels seems to have done little to stop the cycle of dietary-related fads and trends from low fat to low carb to high protein to gluten free to plant based. Maybe these ebbs and flows are just a part of human nature.

Beef, Chicken, and Carbon Emissions

There seems to be rising attention paid to the environmental impacts of meat consumption. Some people see plant-based meat alternatives as one way to address this concern, and they question whether it is possible to see a big shift in the types of “meat” consumers buy. Such a shift, in fact, has occurred over the past fifty years - a period during which we’ve observed a remarkable change in meat consumption patterns.

The figure below shows US per-capita consumption (lbs/person/year) of beef and chicken from 1970 to 2020 based on USDA data. On a retail-weight basis, per capita consumption of beef fell from an annual average of 86 lbs/person in the 1970s to 56.7 lbs/person in 2010s (i.e., from 2010 to 2019) - a 34% reduction. At the same time, chicken consumption went from 38.9 lbs in the 1970s to 86.9 lbs in the 2010s - a 123% increase. Total consumption of these two meats has increased from an annual average of 124.8 lbs in the 1970s to 143.5 lbs in the 2010s.

meatconsumption.JPG

Using the per-capita consumption data (expressed instead on a carcass rather than retail basis), coupled with additional USDA data on yield (lbs produced per animal) over time, one can infer the number of animals each person in the U.S. eats each year on average.

In the 1970s, the average American ate 14.5 chickens/year, a figure that increased to 22.3 chickens by the 2010s. In the 1970s, the average American ate 0.19 cows/year, a figure that fell to only 0.1 cows/year in the 2010s. Stated differently, it took about 5.3 years for the average American to eat one whole cow in the 1970s; at today’s consumption levels, it takes nearly a decade before the average American eats a whole cow.

What is the impact of this consumption pattern change from beef to chicken on one key environmental measure: greenhouse gas (GHG) emissions ?

One UN Food and Agricultural Organization study indicates that there are 5.4 kg of CO2 equivalent gasses emitted for every kg of carcass weight of chicken meat produced. USDA data indicate the average carcass weight of U.S. broilers over the past decade is about 4.53 lbs/bird (or 2.06 kg/bird). This means, each bird is associated with 11.1 kg of C02. Because consumers are now eating 22.3-14.5 = 7.9 more chickens each year than they were in the 1970s, this means they are also emitting 7.9*11.1 = 87.3 kg more CO2 than in the 1970s (assuming the per-head chicken emissions haven’t changed over time).

Has the reduction in beef consumption been enough to offset the increases in carbon emissions from the increased consumption of chicken? According to one study, roughly 22 kg of CO2 are emitted for every kg of carcass weight of beef produced. Cattle carcass weights have averaged about 804.7 lbs/head (or 365.8 kg/head) for the past decade, meaning each cow generates 8,047 kg of CO2 equivalent gasses. Because U.S. consumers are now eating 0.19-0.1 = 0.09 fewer cows each year than in the 1970s, they are emitting 0.09*8047 = 705.6 fewer kg of CO2 equivalent gasses from beef consumption (again, assuming the per-head beef emissions haven’t changed over time). Some of this reduction is because people are consuming less beef (per-capita consumption feel from 116 lbs to 81 lbs on a carcass weight basis), but also because cattle yields have substantially increased from about 617 lbs/cow in the 1970s to 804.7 in the 2010s) - we are getting more beef from each head of cattle.

So, the average American is emitting 87.3 more kg CO2 from extra chicken consumption but has cut 705 kg CO2 from less beef consumption since the 1970s. Looks like a net carbon win. And one that isn’t even close.

One pushback to this point may be that there are more people today than in the 1970s, so per-capita numbers may be misleading. Throughout the 1970s, the US population averaged 215 million, whereas in the 2010s, population averaged 319.6 million. Taking this into consideration, in aggregate, calculations suggest Americans are today consuming about 4 billion more chickens and 8.3 million fewer cattle than in the 1970s. Using the aforementioned per-head emissions implies we are, in aggregate, emitting 44.7 million metric tons (MMT) more CO2 from extra chickens but 67.1 less MMT CO2 from fewer cattle. Thus, on net, we are emitting 22.4 MMT fewer CO2 equivalent gasses from our aggregate beef and chicken consumption today than in the 1970s. Thus, it still appears a net carbon “win” even adjusting for population change.

While we’re at it, the data used in the above calculations can be used to ask a number of counter factional questions.

  • What would today’s aggregate GHG emissions from chicken be if we hadn’t increased productivity (or yield) since the 1970s? Answer: 52.7 MMT more CO2.

  • What would today’s aggregate GHG emissions from chicken be if population staid at 1970s levels? Answer: 25.9 MMT less CO2.

  • What would today’s aggregate GHG emissions from chicken be if per-capita consumption staid at 1970’s levels? Answer: 48.4 MMT less CO2.

Now the same questions for beef.

  • What would today’s aggregate GHG emissions from beef be if we hadn’t increased productivity (or yield) since the 1970s? Answer: 78.73 MMT more CO2.

  • What would today’s aggregate GHG emissions from beef be if population staid at 1970s levels? Answer: 84.67 MMT less CO2.

  • What would today’s aggregate GHG emissions from beef be if per-capita consumption staid at 1970’s levels? Answer: 112.57 MMT more CO2.

To give some sense of scale, the EPA GHG inventory data suggests all U.S. agriculture was responsible for 628 MMT CO2 equivalent emissions in 2019.

All in all, it seems meat consumption patterns have become much more carbon friendly since the 1970s - that’s not a headline one often sees.

********

Note: One assumption in all the above calculations is that the CO2 emissions per head for both chicken and beef haven’t changed over time. While these factors have no doubt changed, it seems unlikely that they have changed enough over time to overturn the basic beef/chicken comparisons above, but I highlight it here to note that the magnitudes are uncertain. Moreover, I’ve converted measures to a per-head (rather than per pound produced) metric because it strikes me that GHG impacts primarily depend on the size of the animal inventory, and if we can get more meat from each animal in the same amount of time (say, from improved genetics), that wouldn’t necessarily imply greater GHG emissions. All my calculations are in this spreadsheet if someone wants to check me.

Finally, thanks to Jack Bobo who asked me some questions, which prompted the writing of this post.

Consumer Acceptance Of Gene Edited Foods

That’s the title of a research paper co-authored with Vicenzina Caputo and Valarie Kilders for the Food Industry Association (FMI) Foundation. The paper came out in 2020 (based on surveys in 2019), but somehow I neglected to mention it here on the blog but was reminded of it earlier today when it was referenced.

Here is the executive summary.

The purpose of this project was to determine market potential and consumers’ beliefs, knowledge, understanding, and acceptance of gene-editing technology and gene-edited foods with the ultimate goal of providing valuable information to producers, retailers, consumers, and policy makers.

To achieve the project objectives, a nationwide consumer survey was developed. The survey was designed and programmed into an online accessible format by the director in August 2019 and administered to 4,487 U.S. food shoppers in September 2019. Different treatments were set up which varied the food product, whether the product was fresh or processed, and the information provided about gene-editing. Respondents were randomly grouped into the treatments. In each case, respondents completed simulated purchasing scenarios where they chose between products labeled to be organic, non-GMO, bioengineered, conventional, or gene-edited at varied price levels.  The core findings are as follows.

·       Regardless of food product, presence of processing, or information, mean willingness-to-pay for organic labels was higher than the other food labels/claims. Respondents considered organic food to be healthier, safer, and more beneficial for animal welfare, but also anticipated organic being more expensive.

·       Willingness-to-pay for gene-edited products tended to be lower than that for conventional and bioengineered ones. However, willingness-to-pay significantly increased with the provision of information; particularly information about the benefits of gene-editing technology. This evidence suggests that willingness-to-pay is not much changed by merely providing respondents with information about gene-editing technology, but rather it is necessary to supplement this information with specific benefit messages if the technology is to be more widely accepted. Benefits to the environment and consumers show an overall stronger impact than benefits to the farmers.

·       Consumers have a very low level of awareness and knowledge about gene-edited products when compared to the mediocre knowledge and high awareness of GMOs. About half of the respondents indicated they had never heard of gene-editing. 

·       Respondents completed open-ended word association tasks, which revealed fear associated with the unknown. Negatively connoted words dominated mentions in relation to “gene-editing.” Furthermore, these mentions closely resembled those given for genetically modified products.

·       Despite the positive perception of the organic products, respondents mostly purchase conventionally produced food products. Even though respondents have higher willingness-to-pay for organic food, it is also higher priced. When directly asked about primary purchase motivations, respondents typically rank price and taste first, while production methods usually fell somewhere in the middle of a list of possible motivations.

·       The cluster analysis resulted in three distinct risk preference segments, risk loving, risk averse, and risk neutral. A closer look at the segments by treatment reveals that when provided with basic information the share of respondents in the risk averse group increases and the risk loving group decreases. This effect reverses when information on the environmental benefits are provided.

·       The willingness-to-pay for gene-editing varies across type of products and levels of processing. As for the former, consumers are willing to pay relatively more for fresh gene-edited vegetables (tomatoes and spinach) compared to fresh meat when information is provided to them. For fresh plant products, the willingness-to-pay is higher compared to their processed counterpart.  On the other hand, the willingness-to-pay for gene-edited meat is higher for bacon than for pork chops.

·       Despite somewhat negative opinions about gene-edited food, some consumers value having the option to buy them. When consumers are informed of the benefits of gene-editing, the market share for gene-edited products (when pitted against organic, non-GMO, conventional, and bioengineered) exceeds 15%. Consumer willingness-to-pay to have gene-edited foods available range from $0.00 to $0.23 per choice.

Results of this study reveal consumers generally think about gene-editing in a negative light. However, over half of the respondents indicate having never heard of the technology. Simply informing consumers about the technology has trivial effects on willingness-to-pay, but specific information about the benefits of gene-editing can significantly improve consumer acceptance of gene-editing.

Consumer Food Buying during a Recession

That’s the title of a paper Brandon McFadden and I wrote for Choices Magazine. Here’s the introduction:

COVID-19 caused significant disruptions in food supply chains and altered consumer buying behavior. The impacts of COVID-19, most notably in the restaurant and food service sectors, are still being realized in food markets months after the initial shutdown. COVID-19 is a unique event with idiosyncratic effects on food consumption. Nonetheless, there are likely longer-term effects of the pandemic that are perhaps more predictable. The pandemic has caused a recession and spike in unemployment during the first quarter of 2020 (NBER, 2021), and there is much that has been learned about consumer food spending and buying behaviors during prior economic downturns that can be leveraged to gain insights about consumer food spending during the pandemic.

There are many differences between the present pandemic-induced recession and the Great Recession, which was associated with a deterioration of the housing market. The Great Recession’s impacts on food spending operated almost exclusively through changes in income and unemployment, whereas the COVID-19 impacts on food spending include these channels and more, including consumer demand shocks (increase in demand for food at grocery and reduction in demand for food away from home) and supply shocks (regulations affected the supply of food service options and temporary slowdown in meat processing from worker illnesses). Additionally, government support during the pandemic actually caused aggregate personal income to increase (FRED, 2021a), and along with a fall in spending on entertainment and travel, aggregate savings rates to increases as well (FRED, 2021b), although the effects are highly heterogeneous across households (Chetty et al., 2020). Despite these differences, understanding the impacts of changes in income, unemployment, and time availability that accompany recessions remains relevant to the current environment.

The paper goes on to discuss research on how food demand changes with income, eating during the great recession, food insecurity during the great recession, and time allocation, income, and food spending, among other topics.