Blog

Effects of sub-therapeutic antibiotics on efficiency of hog farms

From a recent article appearing in the American Journal of Agricultural Economics by USDA economists Nigel Key and William McBride:

A substantial share of U.S. hog producers incorporate antimicrobial drugs into their livestock's feed or water at sub-therapeutic levels to promote feed efficiency and weight gain. Recently, in response to concerns that the overuse of antibiotics in livestock could promote the development of antimicrobial drug-resistant bacteria, the U.S. Food and Drug Administration adopted a strategy to phase out the use of antibiotics for production purposes. This study uses a stochastic frontier model and data from the 2009 USDA Agricultural Resource Management Survey of feeder-to-finish hog producers to estimate the potential effects on hog output and output variability resulting from a ban on antibiotics used for growth promotion. We use propensity score nearest neighbor matching to create a balanced sample of sub-therapeutic antibiotic (STA) users and nonusers. We estimate the frontier model for the pooled sample and separately for users and non-users—which allows for a flexible interaction between STA use and the production technology. Point estimates for the matched sample indicate that STA use has a small positive effect on productivity and production risk, increasing output by 1.0–1.3% and reducing the standard deviation of unexplained output by 1.4%. The results indicate that improvements in productivity resulted exclusively from technological improvement rather than from an increase in technical efficiency.

Now, that doesn't mean sub-therapeutic antibiotics should be used in animal agriculture, but this does provide one estimate of the benefits that can be compared against the potential costs that might arise as a result of resistance, etc.

Strange Claims on Meat Consumption

Alison Spiegel at Huffington Post recently ran a story with the lead title: 

Chicken More Popular Than Beef In U.S. For First Time In 100 Years

As best I can tell, however, claim isn't true.  It is true that per capita consumption of chicken is increasing, but it surpassed beef back in the early 1990s.

The claim comes from a graph, which was reproduced from a story by Priceonomics,who in turn took it from Angela Wong at NPR, who in turn cites the Earth Policy Institute.  Beyond that, I have no idea where the data come from.  

For context, here is the graph from Huffington Post:

percapitawrong.JPG

But, according to USDA data, per capita chicken consumption passed beef in about 1992.  Here, for example, is a graph from the Livestock Marketing Information Center (which uses USDA data).

percapitaright.JPG

Oddly, the Earth Policy Institute has, on their web site, a graph showing something similar to the LMIC.  

There may be a rational explanation for the discrepancy (such as differences in data sources or differences in what is being counted in "total chicken") but without any details we only have to guess.

One final point.  Yes, per capita consumption of chicken is on on the rise and has been higher than beef for now over 20 years (according to USDA data).  But, that is largely because chicken has become much less expensive and, lately, beef more expensive.  

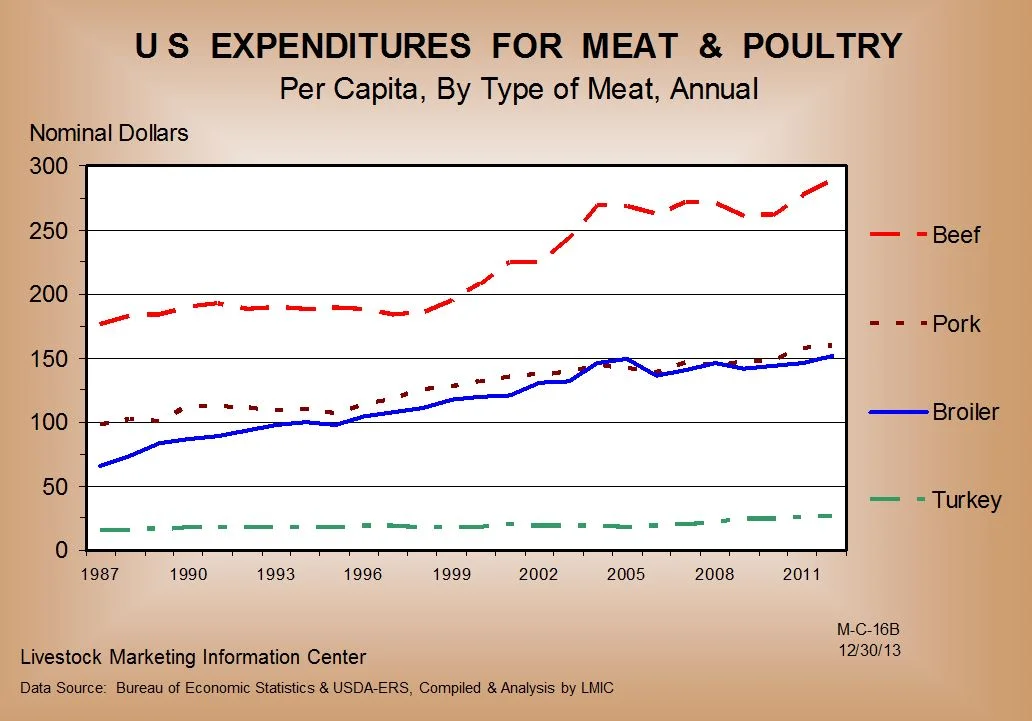
Thus, I don't know that we should say chicken is more "popular" than beef.  Indeed, people SPEND much more money on beef than chicken - about twice as much as the following graph shows.  If we judge by dollars spent, beef is much more popular than chicken.

meatexp.JPG

The Cost of Corn in Meat

I recently ran across this publication from the USDA-Economic Research Service back in 2008.  The piece, written by Ephraim Leibtag, is mainly about the high costs of corn at the time (they subsequently went much higher), and the potential impacts on the cost of food.

That publication had a little back of the envelope calculation that I found very interesting, as it relates to the argument that meat production is wasteful - a topic I've discussed before.

Here is Leibtag:

To avoid downplaying potential impacts, this analysis uses upper-bound conversion estimates of 7 pounds of corn to produce 1 pound of beef, 6.5 pounds of corn to produce 1 pound of pork, and 2.6 pounds of corn to produce 1 pound of chicken.  Using these ratios and data from the Bureau of Labor Statistics, a simple passthrough model provides estimates of the expected increase in meat prices given the higher corn prices. The logic of this model is illustrated by an example using chicken prices. Over the past 20 years, the average price of a bushel of corn in the U.S. has been $2.28, implying that a pound of chicken at the retail level uses 8 cents worth of corn, or about 4 percent of the $2.05 average retail price for chicken breasts. 

I don't know about you, but 8 cents doesn't seem like a lot.  If that corn is "wasted" (I've previously argued that "waste" is the wrong word here), that's not much waste.

I don't know exactly how Leibtag made his calculation, but I'll make an even cruder one using current figures.  The price of corn today is around $4.15/bushel.  There are 56lbs in a bushel, so corn costs $0.074/lb.  So, if a steer requires 7 lbs of corn to make 1 lb of beef, then the cost of the corn in a pound of beef is: $0.074*7 = $0.519.  The retail price of beef today is around $5/lb, so about 10.3% of the retail price of beef is feed corn.  That means about 90% of the retail price of beef is due to other stuff.  

Similar calculations show that for a pound of pork $0.48 of the retail cost is due to corn and for chicken it is $0.19 (this is higher than Leitbag's numbers because, among other things, the cost of corn today is much higher and because my calculation also underestimates the costs of feed in a pound of retail product because it doesn't take into account the ability of farmers to substitute toward cheaper feeds).  Given retail prices of for pork and chicken are $3.8/lb and $2/lb, that means that 12.8% and 9.9% of the retail prices of pork and chicken.  

So, the vast majority of the cost of meat - around 90% - is due to non-feed factors.  

Sometimes a little context is useful in these debates.


FooDS December 2013

The December edition of the Food Demand Survey (FooDS) is now up.

A few observations from the survey:

  • Willingness-to-pay (WTP) for chicken products was down in December.  In fact, WTP for chicken breast was at the lowest level since the survey started back in May.
  • WTP for steak only declined 4.3%, but was also at the lowest level seen since FooDS started.
  • The only meat product to witnessed increased WTP was hamburger.
  • Stated concern for all 17 food issues we track fell in December relative to November.  
  • This month, consumers heard less in the news about Salmonella and E coli and more about GMOs and farm animal welfare.
  • In a ranking of seven food challenges, the largest increase in December was "loosing weight".

As in the past, we added several ad hoc questions.  Given my recent visit to BPI, I was curious to learn more about consumers' perceptions of lean fine textured beef (LFTB), a product that has been called "pink slime" by some media outlets (I should note that these questions were added of my own volition, not at the request of BPI).  We asked "Which of the following do you believe is true or false about lean finely textured ground beef (otherwise known as "pink slime")?"  Here is what we found:

lftbtf.JPG

Most consumers correctly indicated that LFTB lowers the price of lean ground beef.  however, they also got quite a few facts wrong, and the results underscore the misconceptions people have about the product, some of which have been fostered by media outlets.  For example, more than half the participants thought LFTB led to illnesses, was used in dog food, and is unsafe to eat.  Only 25.59% thought beef is the only ingredient (so much for the effectiveness of the "beef is beef" campaign), and more than three-quarters disagreed that LFTB improved the taste of beef.  

We also asked a subsequent question, where respondents ranked the desirability of different hypothetical ground beef options that varied by price, LFTB content, fat content, and taste.  Analysis of this data suggests taste is the most important factor but that people were WTP substantive premiums to avoid LFTB.  That said, people also stated a preference for leaner ground beef.  Overall, the results imply that some the consumers' dislike of LFTB can be offset by: 1) better taste, 2) lower price, or 3) some combination of lower fat content and lower price or better taste.   

How surveys can mislead

Beef Magazine recently ran a story about changing consumer attitudes.  The story discussed the results of a nationwide survey which asked the question: "How has your attitude about the following issues changed during the past few years?"  Here is a screenshot showing the results  

moreconcerned.JPG

So, according to the survey, 29%+35%=64% of consumers are today more concerned about antibiotics than they were a few months ago.  In fact, the figure suggests that more than half of the respondents are more concerned today about antibiotics, hormones, GMOs, animal handling, and farmer values.   

I would submit that these findings are almost entirely a result of the way the question is asked.  Are you more concerned about issue X today?  Well, of course, any reasonable, caring person is today more concerned about X.  Indeed, why would you even be asking me about X unless I should be more concerned?

More generally, drawing inferences from such questions shows the danger of taking a "snapshot" as the truth.  To illustrate, let's compare how the above snapshot looks compared to the trends that come up in the Food Demand Survey (FooDS) I've been conducting for eight months.  

In that survey, I ask over 1,000 consumers each month a question, "How concerned are you that the following pose a health hazard in the food that you eat in the next two weeks?"  where the five-point response scale ranges from "very unconcerned" to "very concerned".  

I pulled out responses to the four issues that most closely match the survey above and plotted the change over time (I created an index where the responses in each month are relative to the response back in May which was set equal to 100).  If people are generally more concerned about these issues today compared to six months ago, it isn't obvious to me from the graph below.

So, a word of caution: you can't take every survey result at face value.  These sorts of comparisons show exactly why our Food Demand Survey is valuable: it replaces a snapshot with a trend. 

concernovertime.JPG