I’ve written and been interviewed quite a bit about the spike in egg prices that we’ve been experiencing. Given the volume of interest in the subject and recent claims of price gouging, I thought I’d pull together some data and do a bit of a deep dive.
First, what has been happening to egg prices? The figure below shows the retail price of a dozen large eggs according to the Bureau of Labor Statistics (BLS) and the wholesale egg price reported by USDA (these are nominal prices not adjusted for inflation). I’ve plotted these data over a long time horizon to include the last time we had a significant outbreak of Avian Influenza (AI) back in 2015. Interestingly, reported wholesale prices have converged with retail prices (at least according to these broad aggregate measures), suggesting retailer margins are being squeezed in recent months.
The most recent data is December 2022. Retail egg prices jumped from $1.79/dozen in December 2021 to $4.25/dozen in December 2022 (a 138% increase). Curiously, the BLS also reports an egg price index (as a part of constructing the consumer price index) which is “only” up 58.9% over the past year (see the second figure below). It is a bit unclear why the BLS egg index is so different from the change implied by the BLS average prices reported in $/dozen, but that’s a mystery best saved for another day. The BLS indicates that if interest is in comparing prices over time, the best figure to use is their index number. So, let’s round up and use 60% as the retail price increase in the rest of the this post to indicate the extent to which egg prices have gone up over the past year.
Average egg prices ($/dozen) based on BLS (retail) and USDA (wholesale) data
Year over year change in retail egg prices based on BLS index (https://ag.purdue.edu/cfdas/resource-library/changes-in-u-s-food-prices/)
The question that seems to be in everyone’s mind is “why?” Why have egg prices increased roughly 60% over the past year? The main (and perhaps only) answer is Avian Influenza (AI).
The USDA APHIS reports confirmed cases of AI. Using those data, and focusing just on egg laying hens, here are the number of table egg laying hens affected over the past year.
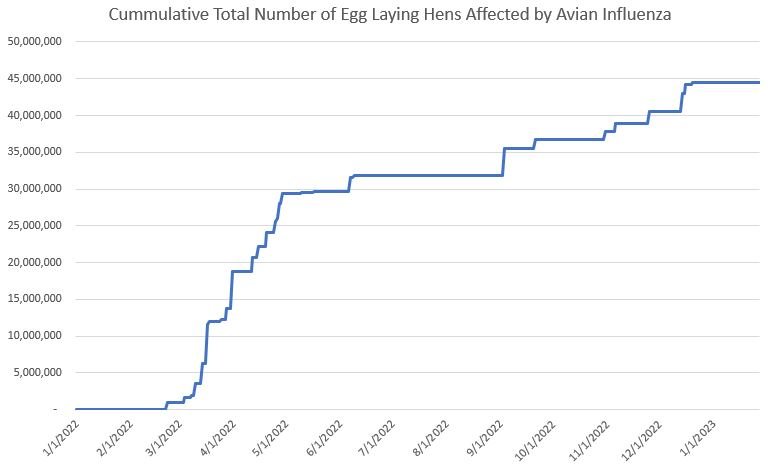
You can’t replace lost hens overnight, so in some ways what is more relevant is the cumulative number of cases over the course of the past year. Here’s that figure.
There have been a total of 44,472,700 egg laying hens affected by bird flu since the first case in mid February 2022. I should note that a few of these cases involved breeding stock, which has a potentially outsized and longer-lasting impact on the industry than the loss of a “regular” egg laying hen.
What has happened to actual production? Here are USDA data on that matter - both in terms of the size of the table egg laying flock and the number of table eggs produced each month.
In December 2022, there were 307,835,000 table egg laying hens in the U.S. compared to 326,730,000 one year prior in December 2021. So, we are down 18,895,000 laying hens over the course of 2022. But, as previously indicated, over the course of 2022, we lost 44,472,700 egg laying hens due to AI. Thus, over 2022, the industry worked hard (and were incentivized by high egg prices) to rebuild: the 44.47 million hen loss from AI “only” resulted in a 18.39 million hen loss by end of year. The industry was effectively able to add back 44.74-18.39 = 25.58 million hens. (note: I’m assuming the number of birds that USDA APHIS reports as “affected” is also the number depopulated.)
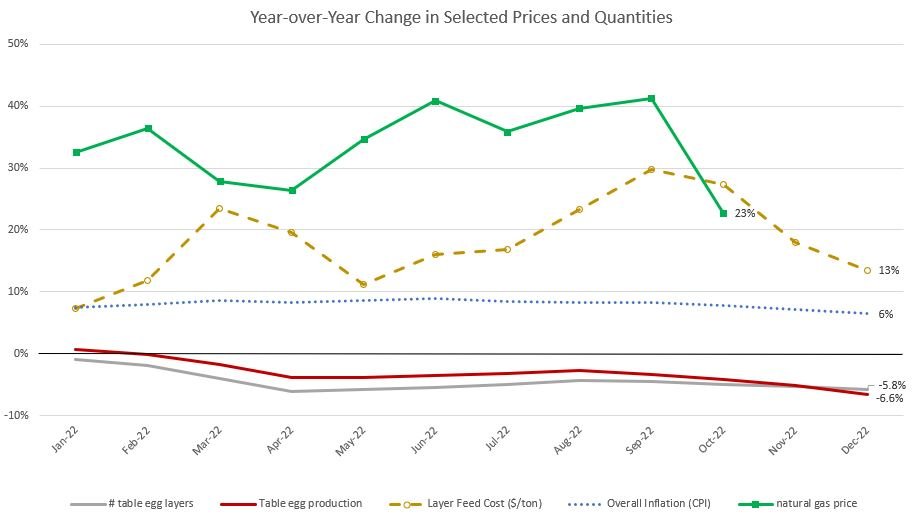
Relative December 2021 (before we were hit by AI), the number of egg laying hens was down -5.8% and actual table egg production was down -6.6% by December 2022 . Had the industry not added back the losses from AI, we would have been down -13.6%. In short, AI more than explains the reduction in flock size experienced over 2022.
What is the impact of these losses on egg prices? On this matter, there seems to be a lot of confusion. How can a small-ish reduction in quantity of eggs supplied (-6.6%) have such a large impact on retail egg prices (+60%)?
Time for some Econ 101. The answer is that egg demand is very inelastic. There aren’t good substitutes for eggs, and as such, consumers continue buying eggs even when prices rise. It takes a significant price increase to cause consumers to cut back. Stated differently, prices have to rise by a sizeable amount to convince enough consumers to cut back on their egg purchases so that there is alignment between the amount produced and the amount consumers want to buy.
The figure below illustrates the basic concepts. The figure on the left considers a good for which demand is inelastic (like eggs) and the figure on the right considers a good which is elastic in demand (i.e., consumer purchases are very sensitive to price changes). In both cases, I consider what happens when we reduce the quantity supplied by a small amount. On the right-hand side, when demand is elastic, a small reduction quantity supplied has an even smaller impact on prices. However, when demand is very inelastic, as illustrated in the left-hand side figure, a small reduction in quantity results in a large price increase. That’s what we’re witnessing for eggs.
A commonly assumed value for the elasticity of egg demand is -0.15. This implies that a 1% increase in price would result in a 0.15% reduction in the quantity of eggs demanded by consumers. We can invert this relationship: a 1% reduction in the quantity results in a 1/0.15 = 6.67% increase in price.
As indicated, we’ve had a 6.6% reduction in quantity of eggs supplied from Dec 2021 to Dec 2022. A 6.6% reduction in quantity supplied would be associated with a 6.6/0.15 = 44% increase in egg prices. That’s not quite the 60% reported by the BLS, but it’s not far off. An egg elasticity of demand of -0.11 (a value that would be consistent with some estimates) would rationalize the observed change in retail egg prices (i.e., 6.6/.011 = 60%).
Backing up for a moment, note that there was a 13.6% reduction in the number of egg laying hens due to AI. Had the industry not added back inventory and had egg production dropped by an equivalent amount, then this reduction in quantity supplied would be associated with a 13.6/0.15 = 90.7% increase in egg prices, much higher than the 60% reported by the BLS.
My initial back-of-the-envelope calculations indicated the AI-induced supply reductions would be associated with a 44% increase in egg prices. But, BLS reports egg prices have increased 60%. Is the “extra” 60-44 = 16% “gouging?” Well, for one, I’ve already indicated if egg demand is just a tad bit more inelastic than I initially assumed, there is no discrepancy. But, there are other explanations as well. Costs of production have escalated over the course of the past year, as the figure below shows. Egg layer feed costs (as reported by the Egg Industry Center) were 13% higher in December 2022 than they were one year prior and were running 30% higher earlier this fall in September. Energy prices are higher too - natural gas prices were about 40% higher through much of the year (the figure below reports changes in the U.S. Price of Natural Gas Sold to Commercial Consumers as reported by the US Energy Information Administration; the last data point is October). And of course, overall inflation is up. As of December 2022, overall prices in the economy are up 6.4% on a year over year basis. Thus, even if there were no unique shocks to egg production and it simply followed all other prices in the economy, we would expect egg prices to be 6.4% higher now than last year.
In short we don’t have to resort to conspiracy to explain the observed increase in egg prices. That doesn’t mean there isn’t malfeasance or collusion but absent any other evidence, the basic economics of the situation go a long way toward explaining the situation we are currently in.
Are egg producers making more money? That depends on whether they have eggs to sell. A producer who lost hens to AI suffer all the associated costs of building back and lost out on the revenue that would have received had they not been hit. If, instead, a producer has been fortunate enough not to be hit by AI, they may well be making more money (although note the figure above indicating that some of their costs have risen as well).
Just because some egg producers may be making more money does not necessarily imply gouging. Here is one commenter:
“But here’s one weird thing: Have you noticed a scarcity of eggs or chicken at the grocery store? I sure haven’t: My local Wegmans is stacked to the rafters with eggs and chicken. Eggs are pricey — they top out at $7.78 — but they’re there.
So maybe something else is going on. Maybe, just maybe, there’s something else responsible for those soaring prices.”
That’s a very strange line of argument. The reason we are NOT seeing widespread stock-outs is because prices are allowed to rise. Those higher prices keep eggs on the shelves for those consumers who most value them. They also incentivize egg producers to get back in the game and produce more eggs. The old saying “the cure for high prices is high prices” is apt. A sure-fire way to have empty shelves would be to put a cap on egg prices or egg producer profits.
All that said, let there be no mistake: high egg prices are bad for consumers. Higher egg prices lower household well-being and increase the odds of food insecurity. How can we get out of this mess? Hopefully innovation will ultimately result in vaccines for AI or new genetic strains more resistant to AI or housing systems or management practices that better protect hens from AI.


