Blog

When Consumers Don't Want to Know

Since I first started working on the topic of animal welfare, I've had the sense that some (perhaps many?) consumers don't want to know how farm animals are raised.  While that observation probably rings intuitively true for many readers, for an economist it sounds strange.  Whether we're talking about GMO labeling, nutritional labels, country of origin labels on meat, or labels on cage free eggs, economists typically assume more information can't make a person worse off.  Either the consumer uses the information to make a better choice or they ignore it all together.    

There is a stream of literature in economics and psychology that is beginning challenge the idea that "more information is better."  One simple explanation for the phenomenon could be that consumers, if they know for sure they will continue to consume the same amount of a good, could be better off ignoring information because the information could only lower their satisfaction (perhaps because they'll feel guilty) for doing something they've already committed to doing.  In this paper by Linda Thunstrom and co-authors, 58% of consumers making a meal choice chose to ignore free information on caloric content, a finding that Thunstrom calls "strategic self ignorance" arising from guilt avoidance. 

Another possible explanation that I've previously published on is that, when people have limited attention, more information on topic A might distract people from a topic B, even though topic B ultimately has a larger impact on the consumers well-being.  

It may also be the case that people want to believe certain things.  They derive satisfaction from holding onto certain beliefs and will avoid information that challenges them.  These ideas and more are discussed by Russell Golman, David Hagmann and George Loewenstein in a nice review paper on what they call "information avoidance" for the Journal of Economic Literature.

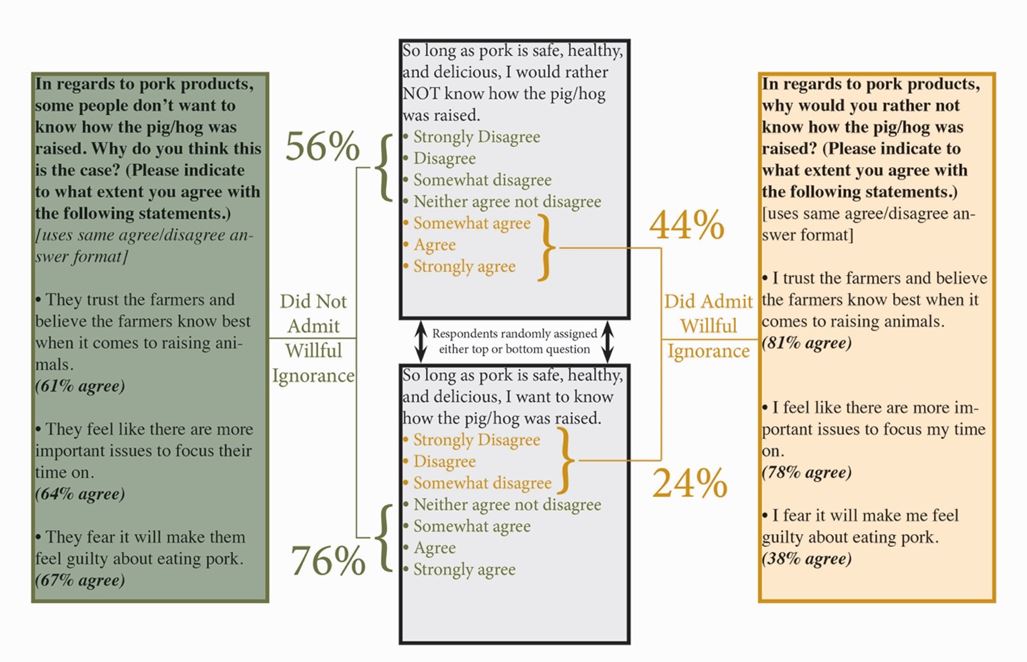
A graduate student in our department, Eryn Bell, has been working with Bailey Norwood to apply some of these concepts to the topic of animal welfare.  They conducted a survey of 1,000 Oklahomans and asked them one of the two simple questions shown below.  Depending on how the question was asked, from 24% to 44% of respondents self declared that they would rather NOT know how hogs are raised.  The primary reasons given for this response were that farmers were trusted (a belief consumers may prefer to hold), that there are more important issues to worry about (limited attention), and guilt aversion. 

In the same survey, Bell and Norwood also included a set of questions based on some ideas I suggested.  The question gave respondents the option to see a picture of how sows are raised or to simply see a blank screen for a certain period of time.  People were divided into three groups that varied how long they had to see the blank screen.  The idea was that we could use the waiting time as a "cost", which would allow us to ask: how long are people willing to wait to NOT receive free information?  As it turns out, people weren't very sensitive to the waiting time.  Nonetheless, regardless of the waiting time, about a third of respondents preferred to see an uninformative blank screen as opposed to a more informative screenshot of sow housing.  These findings suggest at least some people, at least some of the time, would prefer not to know.  

Food Demand Survey (FooDS) - March 2017

The March 2017 edition of the Food Demand Survey (FooDS) is now out.

Some items from the regular tracking portion of the survey:

  • Willingness-to-pay (WTP) decreased for steak, pork chops, and especially deli ham. WTP increased for chicken breast, hamburger, and chicken wings. WTPs for all meat products are lower than one year ago, except for hamburger.
  • Consumers expect higher beef, chicken, and pork prices compared to one month ago. Consumers plan to buy slightly less chicken and beef compared to last month.
  • The largest percentage increase in concern was for bird flu and the largest decrease in concern was for farm animal welfare.

Several new ad hoc questions were added to this month’s survey that mainly dealt with knowledge of farm production practices.

Participants were first asked: “Have you ever worked on a farm or ranch?”. About 17% of participants answered “yes.” Participants who answered “yes” were then asked “which of the following best describes the kind of farm you worked on?” Respondents were provided with six options and they could check all that applied.

Of the 17% who said they had worked on a farm, 43% checked “A farm that produces commodity crops (e.g. corn, wheat, soybeans, cotton, or rice)” followed by 40% who checked “A farm that produces commercial livestock (e.g. cattle, swine, or poultry).” “A garden in your backyard” was picked by 38% and “A chicken coop in your backyard” was picked by 23%. 20% checked “other” (and provided responses such as working on a dairy farm or a horse farm or on school farms such as FFA), and 12% checked “A community garden”.

Secondly, participants were asked: "Which of the following animal production industries use added growth hormones?” Over half of participants stated that believed beef, pork, poultry and dairy industries use added growth hormones. Over 75% of participants indicated that they thought that the beef cattle industry uses added growth hormones. Over half of the respondents stated they believe the swine and poultry industries to uses added growth hormones. In reality, the swine and poultry industries do not use any added growth hormones. About 57% of participants stated they believed added growth hormones are used in the dairy industry.

Third, participants were asked: “What percentage of dairy cattle in the U.S. are treated with rBGH?” Overall participants perceive a much greater use of rBGH in dairy cattle than what is actually used. About 20% of participants believe that 50-59% of dairy cattle are treated with rBGH. 5.7% believe that 90- 100% of dairy cattle are treated with rBGH. Only, 10.9% of participants stated that less than 10% of dairy cattle are treated with rBGH. In reality, less than ten percent of all dairy cattle in the U.S. are treated with rBGH.

Lastly, participants were asked: “To what extent do you agree or disagree with the following statements?” Individuals responded on a 5-point scale: 1=strongly disagree, 2=somewhat disagree, 3=neither agree nor disagree, 4=somewhat agree, 5=strongly agree.

The most common answer for each item was “neither agree nor disagree”, except for the statement all milk contains natural hormones where the most common answer was “somewhat agree”. The statement “all cow’s milk contains natural hormones” was agreed upon most, whereas the statement “hormones are never given to dairy cattle” was agreed upon least.
About 38% of participants answered “somewhat agree” or “strongly agree” that it is healthier to consume milk labeled rBGH free. Approximately 30% of participants answered “somewhat agree or “strongly agree” that conventionally produced milk contains unsafe levels of hormones. Only 5.6% of participants selected “strongly disagree” that milk containing rBGH tastes different.

Does everybody prefer organic?

A few years ago I was giving a talk at a conference in Europe, and I showed the following figure illustrating demand curves for organic milk.  The curves were created based on an analysis of grocery store scanner data (the underlying estimates and analysis are in this paper in the journal Food Quality and Preference).  

I showed the graph to illustrate to the group how demand for organic milk was lower for people that placed a higher relative importance on food safety than it was for people who placed a lower relative importance on food safety.  But, almost in passing, I told the audience that they might take the figure with a grain of salt because it shows that even if organic was the same price as conventional (i.e., the organic premium was $0), the demand curves predict market shares for organic of only about 8% and 14% (depending on the importance of food safety), which I thought was implausibly low.  

After my presentation, an individual who worked for a European food retailer asked why I thought the figures were implausibly low.  I said that I presumed most people would choose organic if it were priced the same as conventional. He said, however, that his retail experience was fully consistent with the graph I showed - even when he substantially lowered the price premium for organic, the market share remained relatively low.   

I've had those anecdotal thoughts in my mind for a while and recently was able to test them out in a more controlled, survey setting where we could vary product price in a way that there aren't confounds.  One of the "confounds" with the European's observation was likely the fact that the organic attribute was likely to appear on less-well-known brands, so we don't know if it was the lesser-known brand or the organic attribute causing the low market share.  Our attempt to remove these confounds is this new paper in the journal Applied Economics Letters co-authored with Seon-Woong Kim and Wade Brorsen.  

We conducted studies with apples and with milk.  In the studies, people made choices between different apples that varied by color (red or green), condition (bruised or not bruised), price, and production method (organic or conventional).  Alternatively, people made choices between milk that differed by fat content (skim, 1%, 2%, or whole), package type (cardboard or plastic), price, and production method (organic or conventional).  

We used the choices to infer the demand curves for organic vs. conventional, allowing for the fact that different consumers are likely to have different preferences for organic and other milk/apple attributes.  Here's what we found.

Even in these controlled studies, we find that if organic were priced the same as conventional (a price premium of 0%), not everyone would buy organic.  Priced evenly with conventional, organic would pick up only about 60% of the apple market (the remaining 40% going to conventional), and organic would pick up only about 68% of the milk market (the remaining 32% going to conventional).  

Given differences in yield and production costs, organic is almost surely going to be routinely higher priced than conventional. But, even if this weren't the case and organic could be competitively priced, these survey results show us that not every prefers organic food.

Banning Soda Purchases Using Food Stamps - Good idea or bad?

According to Politico:

The House Agriculture Committee this morning is delving into one of the most controversial topics surrounding the Supplemental Nutrition Assistance Program: whether to limit what the more than 40 million SNAP recipients can buy with their benefits. Banning SNAP recipients from being able to buy, say, sugary drinks has gotten some traction in certain public health and far-right circles, but it looks like the committee’s hearing will be decidedly open-minded on the debate.

I've written about this policy proposal several times in the past.  It's an example of good intentions getting ahead of good evidence.  Do SNAP (aka "food stamp") participants generally drink more soda than non-SNAP participants?  Yes.  Is excess soda consumption likely to lead to health problems?  Yes.  But, will banning soda purchases using SNAP funds reduce soda consumption.  Probably not much.  

In fact, I just received word that the journal Food Policy will publish a paper I wrote with my former Ph.D. student, Amanda Weaver, on this very topic.  First is the logical (or theoretical) argument:

In public health discussions, however, the conceptual arguments related to the Southworth hypothesis have received scant attention (see Alston et al., 2009, for an exception). A soda consuming SNAP recipient who spends more money on food and drink than they receive in SNAP benefits can achieve the same consumption bundle regardless of whether SNAP dollars are prohibited from being used on soda by rearranging which items are bought with SNAP dollars and which are bought with other income. Thus, an extension of the Southworth hypothesis to this case would predict little or no effect of a soda restriction as long as the difference in total food spending and SNAP benefits does not exceed spending on sugar-sweetened beverages.

If that wasn't transparent, consider the example I gave in this paper I wrote for the International Journal of Obesity:

To illustrate, consider a SNAP recipient who receives $130 in benefits each month and spends another $200 of their own income on food for total spending of $320. Suppose the individual takes one big shopping trip for the month and piles the cart with food, including a case of Coke costing $10. Suppose the cost of all the items in cart comes to $320. SNAP benefits cannot cover the entire amount, but the individual can place a plastic divider on the grocery conveyer belt, put $130 on one side (to be paid for with the SNAP benefits), and put $200 on the other side (to be paid for with cash). Now, suppose there is a ban on buying soda with SNAP. What happens? The individual can simply move the $10 case of Coke from the SNAP side of the barrier to the cash side and replace it with other items worth $10. The end result is the same regardless of whether the SNAP restriction is in place or not: spend $320 and Coke is purchased.

So, in theory, people can "get around" these sorts of SNAP restrictions very easily making the restriction ineffectual.  

Now, back to my Food Policy paper.  Our experiment results show the following: 

As conjectured by H3, for the 65% of participants (78/120) who did not consume soda in T3, soda expenditures were unaffected soda restriction. H4 posited that consumers who had expenditures of more than $2 (including a soda purchase) in T3 would likewise be unaffected by the soda restriction as they moved to T4. However, this hypothesis was rejected (p<0.001). Soda expenditures fell from an average of $1.000 to $0.588, contrary to the theoretical prediction. We find that 58.8% (20/34) of the respondents to which the hypothesis applied behaved as the theory predicted (they did not change soda expenditures); however, the remaining 41.1% (14/34) reduced soda expenditures when moving from T3 to T4.

So, maybe restrictions on soda purchases by SNAP recipients will affect their soda consumption after all.  Here are our thoughts on that:

Previous research has identified heterogeneity in cognitive abilities and in consistency with economic theories (Choi et al., 2014; Frederick, 2005), and future research might seek to explore the extent to which cogntive ability plays a role in the ability of extramarginal consumers to recognze that they can achieve the same consumption bundle despite the soda restriction. In addition, our experiment was a one-shot game. In a field environment, respondents can talk to friends, gain experience, and alter behavior over time as they learn that the same consumption bundle can be achieved despite the restriction. This learing conjecture could be tested in an experimental setting by conducting repeated trials with feedback. It could also be tested using field data (after a policy was passed) by investigating the change in soda purchases for inframarginal buyers over time. Another hypothesis that could explain the anomolous result is that the soda restriction could have non- pecuinary effects, providing information about realtive healthfulness of items or signaling what people “should” be doing. For example, Kaplan, Taylor, and Villas-Boas (2016) found that, following a widely publisized vote to tax sodas, Berkeley California residents reduced soda consumption before the tax was even put into place, illustrating significant information effects surrounding soda consumption policies. Future research could further explore this signaling effect by including a treatment that restricts purchases of food items not generally percieved as unhealthy or by including survey questions about percieved healhfulnes of an item before and after a restriction.

Another thing to keep in mind is that such restrictions may limit people's willingness to participate in SNAP in the first place.  Even in our experimental context, we find that soda restrictions do indeed affect participation as measured by use of the "coupon" or "stamp" (both whether it is used at all and the amount of the coupon used).  

All in all, I think the above discussion shows that despite the intuitive appeal of a simple policy restricting SNAP purchases, the actual consequences are likely to be much more complicated. 

When behavioral biases meet the market

Have you ever gone shopping, only to be overwhelmed by the number of options available to choose from?  You're not alone.  In fact, psychologists have created a name for the phenomenon: the "excessive choice effect."  In one of the more famous studies on the topic, aptly titled "When choice is demotivating", the authors found that when consumers were offered the opportunity to buy an exotic jam, 30% bought when only 6 varieties were presented.  However, only 3% of consumers bought when 24 variety were presented.  On the face of it, this seems to violate basic economic logic: when there are more varieties available, there is a greater likelihood of finding one you like, and thus there should be a higher likelihood of purchase.  

These sorts of findings have led to popular books (like this one titled The Paradox of Choice) and some bold claims that we'd all be happier and our society would have less depression if we (or namely the government) restricted our choice and freedom.  

Well, as it turns out, subsequent studies found that the "excessive choice effect" doesn't always exist, and the phenomena is much more nuanced than first suggested.  

Now, enter of of my Ph.D. students, Trey Malone (who is on his way to an assistant professor position at Michigan State University).  Our co-authored paper on this topic was just released by the Journal of Behavioral and Experimental Economics.  Trey's insight was this: if the "excessive choice effect" (or ECE) exists, surely companies will want to do something about it.  It's bad business to present consumers with so many options that they don't make a purchase.  Yet, in many markets (and in particular in the market for craft beer which was the focus of our study), there is an apparent explosion of variety of choice.  What's going on?  

From the paper:

In a competitive market, the choice architecture is endogenous, and sellers compete to provide environments that consumers find appealing, thereby increasing profits. In such cases, the market, at least partially, provides incentives to ameliorate the ECE by, for example, reducing search costs for consumers (e.g., see Kamenica, 2008; Kuksov and Villas-Boas, 2010; Norwood, 2006). This raises the possibility that ECE may arise in laboratory contexts or oneshot field experiments while at the same time having limited relevance in day-to-day business decisions. Whereas prior research mainly focus on the identification of an ECE, we show that sellers have access to market-specific mechanisms (or informational nudges) that narrow its influence. We demonstrate that if the ECE exists, sellers can mitigate or exasperate its negative effects through targeted interventions.

The interventions (or private nudges) that we consider were beer sellers providing consumers more information about the varieties either through a "special" or the provision of beer advocacy scores.  

Trey worked with a local wine bar in town to run field experiments. Unbeknownst to the patrons, we strategically varied the number of options on the beer menu over time.  The menu either presented 6 or 12 options (note that the menu of 12 included all 6 of the varieties on the smaller menu).  And, we also varied information about the beers as previously indicated, sometimes there was no extra information (the control) and other times we tried to reduce search costs by labeling one of the options a "special" or by providing beer advocacy scores for each option (these are akin to a quality rating by a reliable third party).  

The results are summed up in the following graph:

Thus, we found that the excessive choice effect was alive and well in a real-life purchase setting (people were more likely to NOT buy a beer when there were 12 options as compared to 6), but only when no extra information was provided.  The effect reversed itself when the menu included beer advocate scores. These results show how the excessive choice effect might be turned on and off by companies manipulating search costs.  

One of the main lessens here is that it would be a mistake to take a finding of a supposed "behavioral bias" (like the excessive choice effect) in a laboratory experiment to make grand claims for large government interventions without also considering how consumers and businesses themselves might react to those very same biases in the course of everyday life.