Blog

The Cost and Market Impacts of Slow Growth Broilers

I just finished up a new working paper (available here) with my Purdue ag econ colleague Nathan Thompson and Shawna Weimer, a soon-to-be assistant professor of poultry science at the University of Maryland.

Readers may recall my post from a couple months ago on consumer demand for slow-growth chickens. This new paper focuses on producer costs of switching to slow-growth broiler chicken. Here’s the motivation from the paper (references removed for readability):

While modern broilers only live about six weeks, there are concerns that the bird’s legs are unable to adequately support the larger bodyweights, leading to pain and an inability to exhibit natural behaviors. As a result of such findings, animal advocacy organizations have begun to pressure food retailers to use slower growing breeds, European regulators have encouraged slow growth broilers, national media attention has begun to focus on the issue, and some animal welfare standards and labels have begun to require slower growing broiler breeds. There has been some consumer research on demand for this attribute, but little is known about the added production costs associated with slow growth chickens.

We obtained data from commercial breeding companies on two slow growth broiler breeds (called Ranger Classic and Ranger Gold) and data on two modern fast growing breeds (called Ross 308 and Cobb 500). Here are the growth curves for the four broiler breeds:

slow_growth3.JPG

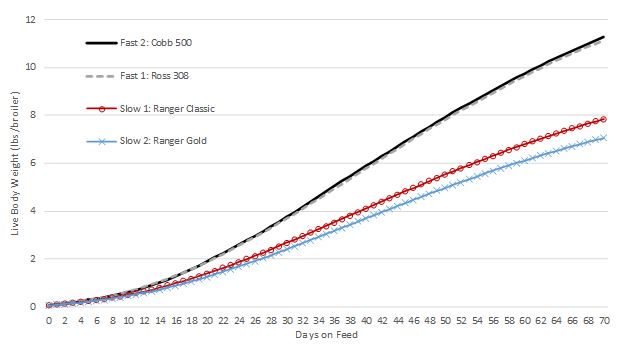
The two slow growth breeds are, well, slower growing. The slower-growing breeds take 54 and 59 days, respectively to reach 6 lbs, whereas the faster growing breeds both hit this target weight in about 41 days.

These growth data are combined with data on feed intake, prices, assumptions about stocking density, and more, and we calculate costs and returns under a number of different scenarios. Here are the main results for the most likely scenario where producers choose the number of days to feed broilers so as to maximize net returns and where slow growth broilers have a more generous stocking density than fast growth broilers, as dictated in many animal welfare guidelines.

slow_growth4.JPG

About 17.45 lbs/ft2/year (or 73%) more chicken on a dressed weight basis is provided by the two fast vs. two slow growth productions systems, on average. Thus, substantially more barn space, or square footage, would be required to produce the same volume of chicken from slow as compared to fast growth breeds. Costs of production average $0.54/lb for the two slow growth breeds and average $0.47/lb for the two fast growth breeds, implying costs are 14% higher per pound for the slower growth breeds. Fast growth breeds are substantially more profitable - generating returns about twice as high per square foot than the slower growth breeds. We calculate that the slower growth broilers would need to obtain wholesale price premiums of $0.285/lb and $0.363/lb to achieve the same profitability as the best performing fast growth breed.

We also use these estimates to calculate potential market impacts that would occur if the entire industry transitioned from fast to slow growth broiler breeds. Under the most likely scenario, we calculate that converting to slow growth breeds would increase retail chicken prices by 1.17% and reduce the amount of retail chicken sold by 0.91%, resulting in losses in producer profits of $3.5 billion/year. We also calculate that consumers would be worse off by $630 million/year, assuming their demand for chicken doesn’t change in response to the switch from slow to fast growth. Increases in consumer willingness-to-pay of 8.5% would be needed to offset the adverse effect on producer profits.

Organic Food Consumption and Cancer

A couple of days ago, JAMA Internal Medicine published a paper looking at the relationship between stated levels of organic food consumption and cancer among a sample of 68,946 French consumers.

The paper, and the media coverage of it, is frustrating on many fronts, and it is symptomatic of what is wrong with so many nutritional and epidemiological studies relying on observational, self reported data without a clear strategy for identifying causal effects. As I wrote a couple years ago:

Fortunately economics (at least applied microeconomics) has undergone a bit of credibility revolution. If you attend a research seminar in virtually any economics department these days, you’re almost certain to hear questions like, “what is your identification strategy?” or “how did you deal with endogeneity or selection?” In short, the question is: how do we know the effects you’re reporting are causal effects and not just correlations.

Its high time for a credibility revolution in nutrition and epidemiology.

Yes, Yes, the title of the paper says “association” not “causation.” But, of course, that didn’t prevent the authors - in the abstract - from concluding, “promoting organic food consumption in the general population could be a promising preventive strategy against cancer” or CNN from running a headline that says, “You can cut your cancer risk by eating organic.”

So, first, how might this be only correlation and not causation? People who consume organic foods are likely to differ from people who do not in all sorts of ways that might also affect health outcomes. As the authors clearly show in their own study, people who say they eat a lot of organic food are higher income, are better educated, are less likely to smoke and drink, eat much less meat, and have overall healthier diets than people who say they never eat organic. The authors try to “control” for these factors in a statistical analysis, but there are two problems with this. First, the devil is in the details and the way these confounding factors are measured and interact could have significant effects. More importantly, some of these missing “controls” are things like overall health consciousness, risk aversion, social conformity, and more. This leads to a second more fundamental problem. These unobserved factors are likely to be highly correlated with both organic food consumption and cancer risk, and thus the estimated effect on organic is likely biased. There are many examples of this sort of endogeneity bias, and failure to think carefully about how to handle it can lead to effects that are under- or over-estimated and can even reverse the sign of the effect.

To illustrate, suppose an unmeasured variable like health consciousness is driving both organic purchases and cancer risk. A highly health conscious person is going to undertake all sorts of activities that might lower cancer risks - seeing the doctor regularly, taking vitamins, being careful about their diet, reading new dietary studies, exercising in certain ways, etc. And, such a person might also eat more organic food, thus the correlation. The point is that even if such a highly health conscious person weren’t eating organic, they’d still have lower cancer risk. It isn’t the organic causing the lower cancer risk. Or stated differently, if we took a highly health UNconscious person and forced them to eat a lot of organic, would we expect their cancer risk to fall? If not, this is correlation and not causation.

Ideally, we’d like to conduct a randomized controlled trial (RCT) (randomly feed one group a lot of organic and another group none and compare outcomes), but these types of studies can be very expensive and time consuming. Fortunately, economists and others have come up with creative ways to try to address the unobserved variable and endogeneity issues that gets us closer to the RCT ideal, but I see no effort on the part of these authors to take these issues seriously in their analysis.

Then, there are all sorts of worrying details in the study itself. Organic food consumption is a self-reported variable measured in a very ad-hoc way. People were asked if they consumed organic most of the time (people were given 2 points), occasionally (people were given one point), or never (no points), and this was summed across 16 different food categories ranging from fruits to meats to vegetable oils. Curiously, when the authors limit their organic food variable to only plant-based sources (presumable because this is where pesticide risks are most acute), the effects for most cancers diminishes. It is also curious that the there wasn’t always a “dose response” relationship between organic consumption scores and cancer risk. Also, when the authors limit their analysis to particular sub-groups (like men), the relationship between organic consumption and cancer disappears. Tamar Haspel, a food and agricultural writer for the Washington Post, delves into some of these issues and more in a Tweet-storm.

Finally, even if the estimated effects are “true”, how big and consequential are they? The authors studied 68,946 people, 1,340 of whom were diagnosed with cancer at some point during the approximately 6 year study. So, the baseline chance of any getting any type of cancer was (1340/68,946)*100 = 1.9%, or roughly 2 people out of 100. Now, let’s look at the case where the effects seem to be the largest and most consistent across the various specifications, non-Hodgkin lymphomas (NHL). There were 47 cases of NHL, meaning there was a (47/68,946)*100 = 0.068% overall chance of getting NHL in this population over this time period. 15 and 14 people, respectively, in the lowest first and second quartiles of organic food scores had NHL, but 16 people in the third highest quartile of organic food consumption had HCL. When we get to the highest quartile of stated organic food scale, the number of people with HCL now dropped to only 2. After making various statistical adjustments, the authors calculate a “hazard ratio” of 0.14 for people in the lowest vs. highest quartiles of organic food consumption, meaning there was a whopping 86% reduction in risk. But, what does that mean relative to the baseline? It means going from a risk of 0.068% to a risk of 0.068*0.14=0.01%, or from about 7 in 10,000 to 1 in 10,000. To put these figures in perspective, the overall likelihood of someone in the population dying from a car accident next year are about 1.25 in 10,000 and are about 97 in 10,000 over the course of a lifetime. The one-year and lifetime risk from dying from a fall on stairs and steps is 0.07 in 10,000 and 5.7 in 10,000.

In sum, I'm not arguing that eating more organic food might not be causally related to reduced cancer risk, especially given the plausible causal mechanisms. Rather, I’m arguing that this particular study doesn’t go very far in helping us answer that fundamental question. And, if we do ultimately arrive at better estimates from studies that take causal identification seriously that reverse these findings, we will have undermined consumer trust by promoting these types of studies (just ask people whether they think eggs, coffee, chocolate, or blueberry increase or reduce the odds of cancer or heart disease).

It’s Election Season – For Food Too. California Prop 12 Edition

At this point, you’ve probably seen enough campaign ads that you don’t need me to tell you that elections are around the corner. 

Among several food and agricultural issues up for vote this year across the country is Proposition 12 in California.  The official California voter guide has the following information on the initiative:

prop12.JPG

If this feels like deja vu, you’re right. California votes passed a similar law in 2008 (Prop 2).  The new bill (Prop 12) goes further by explicitly specifying a minimum amount of space per farm animal and by requiring cage free production systems for egg laying hens by 2022.

Allison Van Eenennaam, animal scientist at UC Davis, has weighed in with her (critical) thoughts on Prop 12, and she pointed out the irony that the main donor against Prop 12 is an animal advocacy organization that would like the conversion to cage free to happen sooner than is required in this proposition.

I’ve received a few calls from reporters asking my thoughts on potential market impacts of Prop 12. I’ll share them here.

  • I’ve co-authored two papers on market impacts of the previous Prop 2 and the associated state legislation that went into effect in 2015 (see this paper with Conner Mallally and this one with Trey Malone). The paper with Conner showed a roughly 30% price impact of Prop 2 immediately after it went into place, an effect which fell to about 10% about a year and a half later.

  • There are reasons to expect Prop 12 to have smaller or larger effects than what we measured for Prop 2.

    • Why smaller? An increasing share of egg production, nationwide, is coming from cage free production systems (see data here), and if pledges by food retailers to go cage free are upheld, more than three quarters of the industry will be cage free by 2025. Moreover, a number of other states have passed laws to go cage free. Given these apparent trends toward increasing cage free, the effects of Prop 12 per se may be small. That’s not to say that egg prices won’t rise (they will), but that Prop 12 may not be the ultimate proximate cause.

    • Why larger? Well, retailer pledges may not be upheld and industry conversion to cage free has slowed. Cage free and organic combined are only around 17% of the total laying flock at present. Moreover, our previously estimated price impacts of Prop 2 occurred in a situation where producers did not have to undertake large capital investments. Producers could comply with the space requirements that resulted from Prop 2 by removing a hen or two from a cage. By contrast, Prop 12 will require entirely new housing systems, resulting in significantly higher conversion costs than did Prop 2.

  • If I was forced to make a guess about the effect size coming from a future study of the impacts of Prop 12 (a future study like the ones I conducted with Conner or Trey), I’d guess something around a 15-25% price increase in retail shell egg prices by mid-2022 relative to the counterfactual of no Prop 12.

  • There are other impacts of Prop 12 that are getting less attention but could have big impacts. In particular, Prop 12 would prohibit sales of pork from gestation crate systems. Because California relies on the rest of the U.S. for virtually all it’s pork, I could imagine situations in the short run where retailers have difficulty sourcing enough supplies that comply with the new regulation. If this seems far fetched, remember when Chipotle had to stop selling carnitas, and then, for at time, sold the pork dish with supplies that did not meet it’s guidelines? Another potential consequence, noted by Van Eenennaam is that Prop 12 would prevent “scientific and agricultural” research from studying animal behavior in conditions that don’t comply with Prop 12. It’s hard to quantify the impact of the inability to learn about certain research questions, but the impact isn’t zero.

Happy voting!

Look at Me, I'm Buying Organic

That’s the title of a new paper I co-authored with Seon-Woong Kim and Wade Brorsen, which was just published in the Journal of Agricultural and Resource Economics.

We know consumers have a number of motivations for buying organic food - from perceptions about health, taste, safety, and environment to perceptions about impacts on smaller farmers. Whether these perceptions are accurate is debatable. In this paper, we were interested in an all together different motivation: the extent to which consumers feel social pressure to buy organic.

In our study, people made simulated choices between apples or milk cartons, where one of the characteristics was the presence or absence of the organic label. People were divided into one of four groups:

1) The control (CTRL): no manipulation.

2) The eye (EYE) treatment. This is going to sound crazy, but following some previous research, we showed an image of a person’s eyes on the screen as people were making their apple and milk choices. Prior research suggest that exposure to an image of eyes creates the aura of being watched, which increases reputational concerns and cooperative behavior.

eyes2.JPG

3) The name (NAME) treatment. Just prior to the apple/milk choices, people in this group were asked to type in their first name, and we ask them to confirm if they lived in the location associated with their IP address. The idea was to remove the perception of anonymity and increase social pressure.

4) The friend (FRND) treatment. Here we used a vignette approach. Jut prior to the apple/milk choices, people were told, “Now, imagine you are in the specific situation described below. Your good friends have family visiting. They’ve asked you to help out by taking their sibling, whom you’ve never met, to the grocery store. While you’re there with your friend’s sibling, you also need to do some shopping for yourself.”

If social pressure is a driver of organic food purchases, willingness-to-pay for the organic label would be expected to be higher in the EYE, NAME, and FRND treatments relative to the control.

Here are some summary statistics showing the percent of choices made by consumers in each treatment group in which a product with the organic label was chosen.

organic_seon.JPG

We see some support for the idea that organic is more likely to be chosen in the social pressure treatments (EYE, NAME, FRND) than the control. The effects are statistically different, but that aren’t huge for every treatment considered. However, the above table doesn’t consider price differences. When we convert the choices into a measure of willingness-to-pay, we find the biggest effect is for the vignette (FRND). For this treatment, we find willingness-to-pay for organic is about 88% higher for apples and 82% higher for milk than the control.

For all groups, we found that education levels moderate the relationship between the social pressure treatment variables and willingness-to-pay for organic. In particular, social pressure is higher for more highly educated consumers. The effect was particularly large in the EYE treatment, where more highly educated consumers valued the organic label between 150% and 200% than less educated consumers when exposed to eyes.

organic_seon2.JPG

These results provide evidence that at least a portion of organic consumption is likely driven by a form of conspicuous consumption. Some might call it a form of conspicuous conservation, but that’s a whole other can of worms.

Trends in National School Lunch Program

Back in 2010, the U.S. Congress passed the Healthy, Hunger-Free Kids Act. The Act, championed by Michelle Obama, provided funding for free and reduced price school lunches and breakfasts, introduced a variety of new nutritional guidelines, and provided incentives for schools to offer healthier options.

The law went into effect at the beginning of the 2012-2013 academic year. There was a fair amount of initial push back. A video from these Kansas students protesting the calorie restrictions has been viewed more than a million times, and other students took to social media with photos of the new lunches using the hashtag #ThanksMichelleObama. This CNN article from 2017 provides some background and also reports on the efforts of a large school food service industry association to roll back some of the guidelines.

The new guidelines may well have generated some positive health benefits for students who ate school lunches. But, how have these policies potentially affected participation in the National School Lunch Program (NSLP)? Students are not required to eat the school-provided NSLP lunches. Students can bring food from home, go off campus, or find other substitutes at school.

I downloaded some data from the US Department of Agriculture (USDA), Food and Nutrition Service (FNS). These data show that in 2017, 4.89 billion lunches were served under the NSLP, with 73.6% being free or reduced price and the remaining 26.4% of students paying full price. How have these statistics changed over time?

As the figure below shows, there was a nearly linear increase in the number of lunches served each year in the NSLP right up until 2010, after which there was a slowdown and then a slow decline.

NSLP.JPG

The effects can be seen even more dramatically by converting the data in the above figure to annual percentage changes in the number of NSLP meals served. From 1990 to 2008, the school lunch program grew every year. Since 2011, the program has gotten smaller every year except in 2016. In the six years prior to the law’s enactment in 2010, there was an average annual increase of 1.4% in the number of NSLP meals served, but in the six years since the law’s enactment (from 2012 to 2017), there was an annual average decrease of -1.2% in the number of NSLP meals served.

NSLP3.JPG

The data also suggest another interesting dynamic at play. Below is the percent of NSLP meals that are free or reduced priced. Throughout most of the 2000’s just under 60% of NSLP meals were free or reduced price. Since then, there has been a fairly steady increase in the share of meals that are subsidized. Given that the increase started prior to the enactment of the 2010 Healthy Hunger-Free Kids Act, it is likely that other factors (such as the Great Recession) were playing a role. However, there has continued to be an increase in the share of NSLP meals that are free or reduced price well after the recession ended.

NSLP2.JPG

These data show there are fewer meals being served that fall under the National School Lunch Program umbrella and that students who pay full price have increasingly chose to eat meals not governed by the program.

The figures presented above do not causality prove that the 2010 Healthy, Hungry-Free Kids Act led to the decline in the meals served under the USDA National School Lunch Program, but they are interesting trends about which I was previously unaware.