Blog

What is "Natural"?

I recently completed a survey of over 1,200 U.S. consumers to find out exactly what they think “natural” means when evaluating different foods. The full report is available here and topline results for all questions asked are here (the survey also covered consumers’ perceptions of “healthy” claims, which I’ll blog on later).

Here is the motivation for the study:

While food companies are allowed to use a “natural” label or claim, the Food and Drug Administration (FDA) has refrained from defining the term. One consequence has been a large number of lawsuits in recent years in which plaintiffs claim to suffer harm from being misled about food product contents or ingredients when accompanied with a natural label (Creswell, 2018). In 2015, the FDA requested public comment on the use of the term natural in food labeling, signaling a potential move to define the term. Such events suggest the need for more information about how food consumers perceive and define the term natural.

One of the initial queries was an open-ended question which asked, “What does it mean to you for a food to be called ‘natural’?” Here is a word cloud constructed from the responses.

wordcloud_natural.jpg

Words like artificial, additive, chemical, and organic were most commonly mentioned. More than 10% of respondents specifically mentioned the word artificial. A non-trivial share of respondents suggested the word was meaningless, marketing hype, or that they did not know what the word meant.

Respondents were also provided a list of possible words/definitions and asked which best fit their definition of natural. No preservatives and no antibiotics/hormones topped the list.

natural1.jpg

Despite associating preservatives with lack of naturalness, when asked about specific preservatives, responses are more nuanced. Preservation by canning and with sugar/salt/vinegar were perceived by more people as natural than not-natural, whereas preservation with benzoates/nitrites/sulphites was not.

To hone in on which processes/foods people consider natural vs. not natural, they were shown the following figure. Respondents were asked “Which of the following foods or processes do you consider to be natural? (click up to 5 items on the image that you believe are natural).” The question was repeated except “natural” was replaced with “NOT natural.”

natural2.jpg

You can find some colorful heat-maps of the resulting clicks in the full report. Here, I’ll just note that about half of respondents (47.1%) clicked on the image of the raw commodities as being natural. The next most commonly clicked areas, chosen by between 20% and 30% of respondents, was grits/oatmeal, wash/clean, and wash/grind/slice. Even after showing the processes involved, 19.8% clicked vegetable oil as natural and 13.3% clicked flour as natural. By contrast, “Bleach” was most most frequently clicked (by 33.8% of respondents) as not natural, followed by “Crystalize”, and then alcohol, syrup, and sugar.

A curious result revealed is that, in many case, final foods are often considered more natural than the processes which make them. For example, more people clicked alcohol as natural than clicked fermentation as natural. Vegetable oil was perceived as more natural than pressing or bleaching, both processes which are used to create this final product. Similarly, sugar is perceived as more natural than crystallization, but of course, the latter is necessary to produce the former. These findings suggest that it is possible for a final product to be considered natural even if a process used to make the product is not.

I also asked questions about crop production processes and perceptions of naturalness.

natural3.jpg

About 80% more respondents said organically grown crops were natural as said such crops were not natural. Crops grown indoors and that are hydroponically grown were, on net, seen as more natural than not. All other crop production practices were rated as not natural by more respondents than were rated as natural. Thus, the results suggest consumers are skeptical of the naturalness of most modern crop production practices. Curiously, this is true for use of hybrid seeds. Crops produced with biotechnology were much more likely to be considered not natural than natural. Consumers perceived organic as natural, but not the pesticides used in organic agriculture or the methods (i.e., mutagenesis) used to create many organic seeds. Again, these findings suggest that it is possible for a final product to be considered natural even if a process used to make the product is not; in this case, the finding is likely to result from a lack of knowledge about organic production practices.

On the topic of misperceptions, just because a federal definition of natural exists does not mean consumers know or understand the definition. The USDA currently defines “natural” for meat products, and it is primarily defined as “minimally processed.” However, only about a quarter of respondents in this survey (26.6%) correctly picked this definition when asked how the USDA defines the term. More than 30% of respondents incorrectly believed the USDA definition of natural implies “no hormones” and 23.8% thought a natural label implies “no antibiotics.” These data suggest more than half of respondents are misled by the USDA definition of natural, a result supported by the other recent academic research.

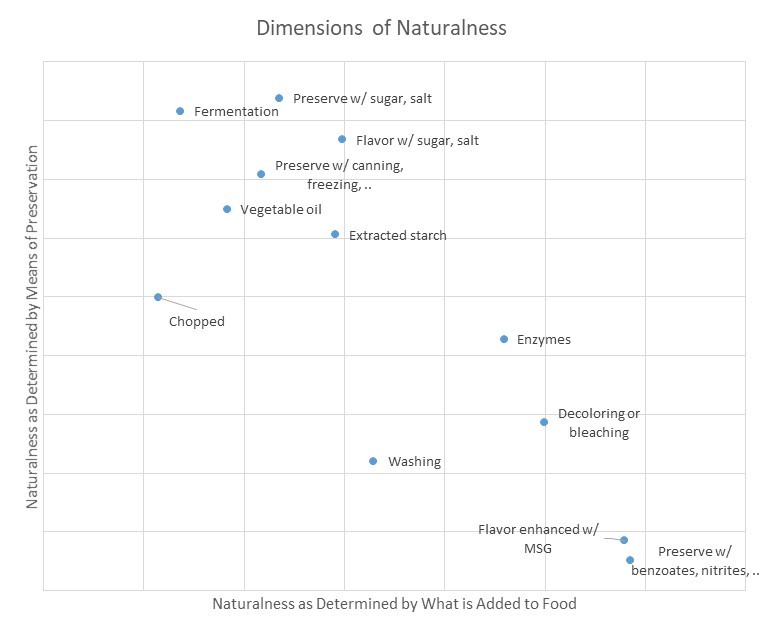
There is a lot more in the detailed report, including more information on question wording and methods of analysis. For example, analysis of correlations between responses (via factor analysis), suggests “natural” is not a single monolithic construct in consumer’s minds, but rather is multidimensional. A food or process can be considered natural on one dimension but not another, as shown in the following figure.

natural4.jpg

Thanks to the Corn Refiners Association, who funded this survey. They gave me free reign to ask the questions and analyze the data as I wanted. You can see their interpretation of the results and their policy recommendations here.


The Coming Meat Wars

By now, I suspect many of you have seen the report by the EAT-Lancet Commission on Healthy Diets from Sustainable Food Systems, which was released on January 16th.

Among other things, the report recommends a dramatic reduction in consumption of meat and animal products. Here is their recommended plate.

new my plate.JPG

Much has been made on Twitter and other places about the size of the small meat and animal product proportions suggested (e.g., 1/4 egg per day), and the fact that more added sugar is suggested than most meat products.

Rather, than going line-by-line through the report, I think it’s useful to take a step back and see this report as another front in what seems to be an escalating war on meat and animal food products (recall the debate surrounding the scientific advisory report on dietary guidelines back in 2015? Here were my thoughts then). What I thought I’d do in response is to provide some broader thoughts about some of the debates that have arisen about meat consumption. My purpose isn’t to defend meat and livestock industries, but to help explain the consumption patterns we see, add some important context and nuance to these discussions, and help ensure consumer welfare isn’t unduly harmed. (Full disclosure: over the years, I’ve done various consulting projects for meat and livestock groups such as the Cattlemen’s Beef Board, the Pork Board, and the North American Meat Institute. All of this work was on specific projects or data analysis related to labels or demand projections, and none of these groups support writing such as this, but I mention it here for sake of transparency).

Here are my thoughts.

  • These debates can be contentious because meat, dairy, and egg production is big business and critically important to the economic health of the agricultural sector. For example, these USDA data show in 2017 in the U.S. the value of cattle/calves was about $67 billion, poultry and eggs about $43 billion, diary about $38 billion, and hogs about $21 billion, for a total of $176 billion at the farm gate. Contrast this with the value of corn ($46.6 billion), vegetables and melons ($19.7 billion), fruits and nuts ($31 billion), or wheat ($8.7 billion). In many ways, livestock/poultry can be see as “value added” production because these animal products rely on corn, soy, hay, and grass

  • Given the farm-level statistics, it shouldn’t be surprising to learn that consumers spend a lot on meat, dairy, and eggs. Data from the Bureau of Labor Statistics, Consumer Expenditure Survey suggest that in 2017 consumers spend about $181 billion on animal products eaten at home. This doesn’t count food away from home, which is 43.5% of food spending according to these data (spending on food away from home isn’t segregated into food types as is food at home). Of total spending on food at home, 32% goes toward meat, dairy, and eggs.

  • If anything, data suggest demand for meat (i.e., the amount consumers are willing to pay for a given quantity of meat) has been steady or rising over the past decade. For example, see these demand indices created by Glynn Tonsor. His data also shows there has been a steady increase in demand for poultry for the past several decades. At the same time, my FooDS data suggests a slight increase in the share of people who report being vegetarian or vegan over the past five years - going from around 4% in 2013 to around 6% in 2018. So, aggregate demand for animal products is up, although there seems to be increasing polarization on both ends of spectrum. We also find that meat consumption is increasingly related to political ideology, with conservatives having higher beef demand than liberals.

  • There are important demographic differences in meat consumption, but the results highly depend on which meat cuts we are talking about. For example lower income households have higher demand for ground beef and lower demand for steak than higher income households. Broadly speaking, meat consumption is a “normal good”, which means that consumption increase as incomes rise. This is particularly true in developing countries. One of the first things people in developing countries add to their diet when they get a little more money in their pockets is animal protein.

  • Given the high levels of aggregate meat consumption indicated above, the evidence suggests strong consumer preferences for meat and animal-based products. Taxes on such products will harm consumer welfare, and will be costly if, for no other reason, because of the size of the industry. Stated differently, consumers highly valuing having animal protein in their diets. This study shows the average U.S. consumer places a higher value on having meat in his or her diet than having any other food group.

  • Calls for taxes are often predicated on the notion that there are externalities from meat, egg, and dairy production that need to be internalized (otherwise, this would amount to little more than “nannying” or paternalism). The externalities on the health care front presumably come from the fact that we have Medicare and Medicaid, which socialize health care costs. As I’ve written about on many occasions (e.g., see this paper), these “externalities” do NOT create economic inefficiencies because they simply represent transfers from healthy to the sick. Any inefficiencies that arise occur because of moral hazard (i.e., people eating unhealthy because they think the government/taxpayers will foot the bill), and the solution to this insurance problem is typically to require deductibles or risk-adjusted insurance pricing, which nobody seems to be proposing as a solution. As for environmental externalities, the key is to ensure prices for inputs such as water or energy, or outputs such as carbon or methane, reflect external costs. In this sense it isn’t the cow or chicken that is the “sin” but the under-priced water or carbon. Here the goal is to adopt broad policies that apply to all sectors (ag and non-ag) and that encourage and allow for innovation to reduce impacts.

  • On climate impacts of animal agriculture, it is important not to confuse global figures of climate impacts with U.S. figures, which tend to be much lower (e.g., see my piece in the WSJ a few years ago on this topic). Why would climate impacts be lower in the U.S.? Because we tend to be more intensified and productive than elsewhere in the world. I know it sounds counter-intuitive, but more intensive livestock operations (because of the massive productivity gains) can significantly reduce environmental impacts when measured on a per unit of output (e.g., pound of meat or egg) basis.

  • As for carbon impacts, the big culprit here is beef and to a lesser extent (due to the smaller cattle numbers), dairy. Why? Because cattle are ruminants. The great benefit of ruminants is that they can take foodstuffs inedible to humans (e.g., grass, hay, cottonseed) and convert them into products we like to eat (e.g., cheese, steak) (see further discussion on this here). The downside is that ruminants create methane, which is a potent greenhouse gas (GHG). The good news is that the GHG emissions from beef production have significantly fallen over time because of dramatic productivity gains (see this paper), but they’re not zero. It’s also important to note that not all greenhouse gasses are created equal, and while methane is a potent greenhouse gas, my understanding is that the impacts from livestock are less persistent in the atmosphere than are other types of greenhouse has emissions. While we can cut GHG emissions by eating less beef, at least in the U.S., the impacts are fairly small (the EPA puts contributions from livestock at around 3-4% of the total), we can also make strides by continuing to increase livestock productivity.

  • While cattle are more problematic on the GHG front, it is important to note that there are likely tradeoffs (real or perceived) on the animal welfare front in comparison with other species. Most beef cattle live most of their lives outdoors on a diet of grass or hay. Cattle often make use of marginal lands that would be environmentally degrading to bring into row crop production. By contrast, most pork and poultry live the vast majority of their lives indoors on a diet of corn and soy. See my book with Bailey Norwood on the topic of animal welfare.

  • There are some interesting innovations happening on the “lab grown meat” and “plant-based protein” space, which aim to replace protein from animal based sources. I haven’t seen these innovators make many claims about relative health benefits, but they often suggest significant benefits in terms of environmental impacts. I hope they’re ultimately right, but they’ve got a long way to go. Lab-grown meat isn’t a free lunch, and all those cells have to eat something. As I’ve also noted elsewhere, it is curious that these products (plant- or cell- based) are still more expensive than conventional meat products. If these alternative proteins are really saving resources, they should ultimately be much less expensive. Time will tell.

  • Despite the excitement around the alternative protein sources, I don’t think we’ll see an end to cattle production anytime in the near future. Why? Well, there is the aforementioned marginal land issue; many agricultural lands aren’t very productive for use in other activities other than feeding cattle or housing other livestock or poultry. Another issue is that cattle and other livestock are food waste preventing machines. A big example here is distillers grains. What happens to all the “spent” grain that runs through ethanol plants or beer breweries? Its feed to livestock. The same is true of “ugly fruit”, non-confirming bakery items, and more. Also, without animal agriculture, where will organic agriculture get all it’s fertilizer, which currently comes from the manure of conventionally raised farm animals?

  • Back to the EAT-Lancet commission, one of the big arguments for reducing meat consumption is health. While there are many studies associating meat consumption with various health problems, the strength of evidence is fairly weak. One big problem is that it’s really tough to do dietary-impact studies well and a lot of the evidence comes from fairly dubious dietary recall studies, but the other issue is that there is generally little attempt to separate correlation from causation. As I’ve written in other contexts, “Its high time for a credibility revolution in nutrition and epidemiology.”

  • The EAT-Lancet report focuses both on health and sustainability issues. However, as I noted with regard to the 2015 dietary guidelines, which initially aimed to do the same, this conflates science and values. As I wrote then, “Tell us which foods are more nutritious. Tell us which foods are more environmentally friendly. But, don't presume to know how much one values taste vs. nutrition, or environment vs. nutrition, or price vs. environment. And, recognize that we can't have it all. Life is full of trade-offs.”

  • Finally, I’ve heard it suggested that we need new policies and regulations to offset bad farm policies, which have led to overproduction of grains and livestock. This view is widely believed and also widely discredited. For example, see this piece by Tamar Haspel in the Washington Post. In the U.S., beef, pork, broilers, and eggs receive no direct production subsidies. Yes, there are various subsidies for feedstocks like corn and soy, but there are also other policies that push the prices of these commodities up rather than down (why would farmers want policies that would dampen the prices of their outputs?). Large scale CAFOs (confined animal feeding operations) must comply with a host of rules and regulations that raise costs (it should be noted that the government provides some funding, through the Environmental Quality Incentives Program (EQIP) program, to incentivize certain practices by CAFOs thought to improve environmental outcomes). If U.S. farm bill was completely eliminated, there would not doubt be some change, but it wouldn’t do much to change the volume of meat, dairy, and egg produced.

That’s more than enough to chew on for now.

Crop Yields and Taste

That modern agriculture is incredibly productive - much more than the past - is undeniable. These USDA data, for example, suggest we produce about 170% more agricultural output now than in the late 1940s. I have argued that these these increases in agricultural productivity are signals of improved sustainability. Some people believe the the productivity improvements have been accompanied with offsetting externalities or degredations in animal welfare. A different kind of critique is that modern crops - despite being more productive - aren’t as high “quality.” For example, this piece in Politico by Helena Bottemiller Evich, titled “The great nutrient collapse” discuses evidence that vitamin content of crops has fallen as yields have increased, and there is the often-heard complaint that tomatoes don’t taste as good as they once did.

There is some biological basis for these latter concerns. If a crop breeder selects plants for higher yields, they are selecting plants that are spending their energy and nutrients into producing bigger seeds and fruits, which is energy that could have gone (in lower yielding plants) to growing leaves or roots or other compounds that affect taste and vitamin content.

I had these thoughts in the back in my mind when I came across the Midwest Vegetable Trial Report put out by researchers at Purdue and other Midwestern universities. The report compares different vegetable varieties in terms of yield and other output characteristics. I noticed for a couple vegetables - green beans and sweet corn - there were also measures of taste for each variety. Granted, these were not full-on scientific sensory evaluations and they involved small numbers of tasters, but still I thought it would be useful to test the conjecture that higher yielding varieties taste worst.

Some researchers from University of Kentucky put together the green bean report. They compared the performance of 19 different varieties of green beans. The most productive variety (named “Furano”) yielded 785 bushels over six harvests, whereas the lowest yielding variety “Slenderette” only produced 233 bu/acre in six harvests. As the image below reveals, however, there was only a weak correlation between taste and yield. The correlation was negative (-0.26), but not particularly large. About 6.6% of the variation in yield is explained by taste. The best tasting variety “Opportune“ had a taste score of 4.1 (on a 1=poor to 5=excellent scale) and a yield of 557; the worst tasting variety “Bronco” had an average taste score of 2.3 and a yield of 543. So, the best tasting bean had better yield than the worst tasting bean. Overall, the results below provide some weak support for a yield, taste trade-off.

greenbean.JPG

The report also provided production and taste data on supersweet corn (this part was authored by Purdue researchers Elizabeth Maynard and Erin Bluhm). They compared 16 different types of bicolored supersweet corn (they also evaluated two varieties of white and two varieties of yellow, which I’m ignoring here). They had tasters rate “flavor” on a 1 to 5 scale. As the figure below shows, there is actually a positive correlation between flavor and yield, as measured by ton/acre. The correlation is 0.15, but the relationship is weak. The authors also report yield in a slightly different way, ears/acre, and by this measure the correlation is slightly negative (-0.09).

cornyieldflavor.JPG

These results don’t necessarily negate the idea that the taste of vegetables has declined over time as higher yielding varieties have been adopted, but they do suggest that in 2017, among the particular varieties tested and among the few tasters asked, there is only a very weak correlation between taste and yield for green beans and supersweet corn.

2018 in Review

With a few hours left in 2018, it’s time to post the traditional annual year in review.

This was my first full year as department head at Purdue and it was a busy one. I won’t recount all the departmental events, but you can catch up on our department’s annual report or our monthly newsletters, which chronicle some of the highlights. Just some of the fun: hiring five new faculty, helping institute several new endowed chairs, hiring several new staff members, ushering in new graduate and undergraduate coordinators, an extension coordinator, a center director, and much more.

2018 was also very active on the research front. I was author or co-author on more than 20 peer-reviewed publications in academic journal articles that will bear a 2018 publication date. I won’t recount all of them, but I was especially glad to see my paper with Jane Kolodinsky on GMO labeling published in Science Advances, a paper on GMO price effects with Nicolas Kalaitzandonakes and Alex De Maisonneuve appear in Food Policy, my paper on effects on California animal welfare laws on retail egg prices with Conner Mullally hit the American Journal of Agricultural Economics, and several papers with Trey Malone finally hit the presses this year. I also wrapped up a couple big projects related to consumer preferences for cage free eggs and slow growth chickens and another on pork quality grade labels with Glynn Tonsor, Ted Schroeder, and Dermot Hayes which finally finished up with publication in Food Policy.

There were a number of memorable trips and meetings this year. I finished my term as past president of the Agricultural and Applied Economics Association at the annual meetings in Washington, D.C. I really enjoyed the dinner talk I gave for the Atlanta Federal Reserve and getting to hang out with Raphael Bostic, the bank’s president. My talk for the Council for Agricultural Science and Technology (CAST) in the USDA atrium/patio in D.C. was fun (but noisy) as was getting to follow Sunny Perdue at the National Grain and Feed Association meeting in Arizona (no, he didn’t stick around for my talk). After a year away, I rejoined Maurizio Canavari, Andreas Drichoutis, and Rudy Nayga to teach the seventh (I think!) edition of our summer school on experimental auctions this time in Bolzano, Italy, which was a nice off-the-beaten-path destination. There were, of course, many more trips and talks, some of which are noted here.

This year on the blog, I had about 56 new posts, and there were over 84,000 page views during the year. The number of page views is about on par with the past couple years, but the number of posts is about half of what I’ve generated the past couple years. My goal in 2018 was to post at least once a week, and I hit that target, but it was below what I’d aimed at in previous years. The decline is fully the result of pressing administrative duties which tend to take up every free moment on my calendar. I’m hoping to keep about the same pace for next year - about one post a week.

Here were the most viewed posts, as judged by pageviews, on the blog in 2018:

One of the nice things about blogging for over six years (I started this site in mid-2012) is that there is a lot of back material that continues to get attention. In fact, in 2018 about two-thirds of the 20 most viewed posts were written in a prior year. The most popular prior posts relate to topics like vegetarianism, meat demand, demand estimation, and the relationship between income and food consumption.

Thanks for tuning in!


Retail Food Prices in 2018 and Beyond

The December 2018 edition of the Purdue Ag Econ Report is out. Some of the questions addressed by my colleagues include:

  • Why will the U.S. economy slowdown in 2019?

  • What are the implications of the Administration’s trade policy in 2019?

  • What was accomplished for agriculture in the new farm bill?

  • Record corn yields and higher corn prices increase corn returns. How much?

  • Record bean yields, Chinese tariffs and trade assistance payments. What’s the net effect?

  • Crop costs for 2019. What crops to plant?

  • Cash rents and land values. Up or down for 2019?

  • What will you be paying for food in 2019?

My contribution was to weigh in on the last question about retail food prices.

Changes in the retail price of food at home have remained low, averaging just 0.5% year-over-year growth over the past five years and 0.4% year-over-year growth thus far through 2018 according to data from the Bureau of Labor Statistics.  Inflation of food prices away from home, by contrast, is higher but has remained fairly stable over time at about 2.6% year-over-year increases.  Since 2016, prices of food at home have grown much more slowly than overall prices in the economy, implying food at home is becoming cheaper in real terms.  Since 2017, changes in prices of food away from home have been at about the same level as prices changes in the rest of the economy. 

foodprices18.JPG

The U.S. Department of Agriculture, Economic Research Service (ERS) projects annual food price inflation, for combined food at home and away from home, of between 0.75% and 1.75% for the year 2018, increasing to 1.5% to 2.5% for 2019.  In 2018, low agricultural commodity prices helped keep downward pressure on food price inflation.  Several commodities, such as pork, dairy, and processed fruits and vegetates experienced overall price declines, or deflation, in 2018.  A few commodities have experienced more significant retail price increases in 2018, including beef (expected to increase about 1.75%) and eggs (expected to increase more than 9% from 2017 to 2018).

 As the foregoing suggests, food price affordability is driven in part by where consumers choose to buy their food.  ERS calculations indicate that since 2010, consumers have been spending more money on food away from than they are on food for at-home consumption.  In 2017, consumer spent almost $870 billion on food away from home and about $747 billion on food at home, implying 54% of food expenditures were for food consumed away from home. 

Even for food consumed at home, consumers are changing their purchasing habits.  Two decades ago, 71% of food for at-home consumption was bought at grocery stores; today the figure is only 58%.  Consumers have shifted food purchases away from grocery stores toward warehouses clubs and superstores.  For food away from home, there has been a slight shift toward more food spending at limited-service restaurants over the past two decades, but overall the share of meal spending at full service restaurants compared to other outlets has remained steady at about 36% of all food away from home spending.