Blog

A Crazy Year in Food

That was the sub-title of an article that Mike Boehlje and I wrote for the Wall Street Journal in their Year in Review. Here is the initial bit.

Disruption! Chaos! Volatility! These are the words that best describe food and agricultural markets, and the business climate that food retailers, processors, input suppliers and farmers faced in 2020. It has been a roller-coaster ride of highs and, mainly, lows both for food consumers and the industry.

The year started with some optimism. Food prices were stable, the trade war was subsiding, and agricultural-commodity prices were showing some strength. China’s hog herd had been decimated by African swine fever, and U.S. hog producers were building inventory in anticipation of burgeoning exports.

Then Covid-19 hit.

Nearly overnight, there was a near-total destruction of demand from restaurants, cafeterias and other food-service venues. Simultaneously, there was a spike in demand for food bought through supermarkets and grocery stores. Spending on food at home was 22% higher in March than January; spending on food away from home was 47% lower in April than January.

The demand shocks had notable effects on consumers, ranging from empty grocery-store shelves to a rapid increase in retail food prices. From March to April, retail prices increased 2.6%, a monthly increase higher than any since the dramatic inflation witnessed in the 1970s.

We discussed the impacts of COVID at the farm level and the recovery in farm prices that have ensued this fall. Here are our closing words.

In all, the events of 2020 will likely be remembered as catalysts for significant changes in the food system—and the source of great uncertainty for consumers and suppliers. Making the supply chain more resilient, for instance, may mean higher prices for consumers. And farms may lean more heavily on automation to protect against the impact of future pandemics—eliminating many jobs.

Those sorts of trade-offs are likely to be the new normal in the industry for years to come.

You can read the whole thing here.

Consumer preferences for GMOs before and after a ballot initiative

The journal Applied Economics Perspectives and Policy just released a paper I co-authored with Alexandre Magnier and Nicholas Kalaitzandonakes.

In this paper, we study how consumers’ purchase intentions toward non-GMO foods evolved leading up to a 2013 ballot initiative (I-522) which would have required the labeling of GM foods in the state of Washington. We are interested in how demand for non-GMO foods responds to a real-word information shock. As we indicated in the paper:

During the several months leading up to the vote, more than $30 million was spent on TV, radio, press, and social media ads supporting and opposing mandatory GM labeling, making I‐522 the second most expensive ballot issue in the state of Washington. Newspaper articles and editorials, door‐to‐door distribution of pamphlets and street activism added to the information flow on agricultural biotechnology and GM foods Washingtonians were exposed to over this period of time.

We asked Washingtonians to respond to some simulated shopping scenarios using a so-called “choice experiment” related to soymilk. We conducted the same exercise at two points in time: seven months before the vote, in late April and early May 2013; and at the time of the vote, during the first half of November 2013.

We found that consumers’ implied willingness-to-pay premium for soymilk with a non-GMO label (the non-GMO butterfly label) fell from $0.68 to about $0.32, a 53% decline, over this period. There were no significant changes in consumer willingness-to-pay for brand or organic or “natural,” but there was a slight increase in how much consumers were willing to pay for soy milk overall.

The fact that preferences for the non-GMO fell is likely a result of the divergence in spending for the pro- vs. anti-mandatory labeling groups. Of the $30 million spend on campaign advertising, 73% was from anti-mandatory labeling groups. The interesting thing is that information related to the desirability of a ballot initiative appears to have spilled over into affecting demand for individual products on the market.

Several other studies have shown that information affects consumers’ attitudes toward GMOs in surveys and laboratory experiments. What this study shows is that even in the messiness of the real world, information can influence consumer preferences and choices regarding GM foods.

Internalities

Even casual followers of economics understand the concept of externalities. An externality arises when an individual does not consider the cost of their actions on other people. A classic example is a factory that does not consider the cost of their pollution into nearby streams or rivers when setting the price of their outputs. While the concept of an externality is fairly clear, what to do about it is less so (see this piece I wrote back in 2013), but typical answers include everything from assignment of property rights and negotiation to so-called Pigouvian taxes. The externality argument has been used extensively in food debates to argue various food stuffs are “too cheap” and that items like sodas or meat or ingredients like sugar, fat, or calories should be taxed.

I won’t re-has all the pro- and con-arguments for these taxes here, except to say that the common claim that we need to re-consider the “true cost of food” because the externality consists of impacts on Medicare or Medicaid is much less obvious than is typically presumed. The point of this post, rather, is to note that I’m starting to see a new argument enter the debate. Apparently, drinking soda not only causes externalities, but it also cause internalities.

What is an internality? An internality is thought to arise when an individual does not consider the cost of their current action on their future self. This article by Allcott, Lockwood, and Taubinsky in the Quarterly Journal of Economics in 2019 derives theoretical conditions for optimal soda taxes when there are externalities and internalities. As empirical evidence of the presence of internalities, they show that consumers who score higher on a nutrition knowledge test consume less sugared soda than consumers who score lower on the test. They calculate that if all consumers had the same knowledge as that of trained nutritionists, the average U.S. household would consume 31% fewer sugar sweetened beverages. They calculate that, on average, sugared beverages would need to be roughly 1 cent per ounce higher to induce people to consume an amount equal to what they’d consume if they had the same knowledge as a trained nutritionist.

Moreover, because lower income consumers tend to score worse on nutrition knowledge tests, Allcott et al. argue that lower income consumers suffer from greater internalities than higher income consumers. As such, their logic is that a soda tax is not regressive as is typically assumed (since lower income consumers spend a higher share of income on food), but rather these taxes are helpful in “correcting” the lower income consumers’ lack of knowledge as compared to higher income households. In fact, a soda taxes is now thought to be progressive because there is greater “correction” needed for lower income households’ purchases.

The concept seems to be catching on. Earlier this year, Dubois, Griffith, and O'Connell published a paper in the American Economic Review where they conduct some interesting and careful analysis to determine what types of households would be most affected by a soda tax (there are a lot of interesting results in their paper; I encourage you to check it out). Their baseline result seems to confirm the conventional intuition that soda taxes are regressive (i.e., primarily borne by lower income households). According to the paper:

We show that compensating variation [the economic welfare losses] associated with a tax on sugary soft drinks is around 20 percent higher for those in the bottom half of the distribution of total annual grocery expenditure (a proxy for income) compared with those in the top half.

However, after assuming tax revenues are redistributed back to consumers in a lump sum, and employing Allcott et al.’s estimate of the benefits from reduction in internalities, they are able to conclude that soda taxes are (from the abstract):

unlikely to be strongly regressive especially if consumers benefit from averted internalities.

I’m a little unsure what to make of the rise of the internality argument as a justification for soda taxes. On a visceral level, it strikes me as paternalistic: “These poor people just don’t know what’s good for them. Experts are here to help.” That’s probably a bit harsh. We have plenty of evidence that people make mistakes; the whole field of behavioral economics rests on this notion (though, as I argue here, it need not justify new regulation).

Though neither of these papers make the link, this work is very similar to the area of literature on the “value of information” (I discuss much of that theory here). The basic idea is that if people change their purchases when they are more informed, then there is value in the information. Or, rather, there would be a “cost” to forcing people to buy what they did in ignorance now that they know more.

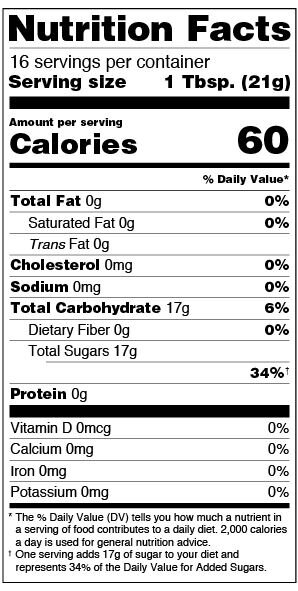
All this is a way of saying: if people suffer from the kind of internality discussed above: why is the right policy response a tax rather than information disclosure or education? Do we have any good studies on how people’s soda consumption changes after being exposed to information on health consequences? How does the “value of information” estimate from those sorts of studies compare to the internality estimates? I’d also note that sodas contain a nutrition facts panel, so the calorie consequences are clearly available for those willing to look. (For those who are interested, here is a seminal paper on the value of information contained in nutrition facts panel by Teisl, Bockstael, and Levy; they also tend to find a higher value of information for lower educated consumers).

I also can’t help but wonder how people would feel if we applied the internality argument to other areas where we know people make choices with objectively false beliefs? Let me give two examples from papers I’ve co-authored just this year.

First, consider this paper co-authored with Ruoye Yang and Kelly Raper. We find that the median consumer thinks 55% of hogs and 57% of chickens raised in the U.S. are given added growth hormones to promote growth. The truth? Zero. Use of added growth hormones is not allowed with these animals. The trouble is that these mis-perceptions distort demand. The results from one of our pooled models suggests that a person who correctly knows the answer is 0% is willing to pay $0.92/lb more for pork or chicken than someone who incorrectly believes the answer is 100% hormone use. According to the internality argument, we’d need to subsidize pork products by $0.92 *0.55 = $0.51/lb to induce the median consumer (who incorrectly believes 55% of pork has added hormones) to consume the same amount of pork as someone with correct beliefs.

Another example is my paper with Lacy Wilson in Food Policy on redundant labels. We find 47% of consumers are willing to pay a premium for non-GMO salt and 41% are willing to pay a premium for gluten free orange juice. These are almost certainly “mistakes”: there is no DNA in salt (and thus it cannot be a GMO) and there is no gluten in oranges. Additional analysis also bears out the fact that these are choices made in ignorance. People who have farm work experience and who have higher scores on a scientific literacy quiz tend to have lower willingness-to-pay premiums for these redundantly labeled products. We find that a person who got a perfect score on our scientific literacy quiz is willing to pay about $0.30 less for a bottle of “gluten free” orange juice than is someone who missed all the questions in the quiz. According to the internality logic, we need to tax orange juice with a gluten free label $0.33 to induce people with the low scientific literacy to consume the same amount of “gluten free” OJ as people with the highest scientific literacy.

How would advocates for an internality-based soda tax feel about advocates for an internality-based pork subsidy or a gluten free orange juice tax? I might imagine an argument that goes something like the following. Well, excessive soda consumption is going to cause real health care costs in the future that people need to consider now; that’s not comparable to “superfluous” harm of over-paying for non-GMO salt or gluten free orange juice or under-buying pork and chicken. But, not everyone who consumes soda will suffer future adverse health consequences and yet all would have to pay the internality tax. By contrast, virtually everyone who pays a premium for hormone free pork or chicken or non-GMO salt is overpaying now. People foregoing pork or chicken because they mistakenly believe these products contain added growth hormones are foregoing those pleasures now. Moreover, these magnitudes can add up across people and over time. For some context, total retail pork expenditures in the U.S. were in the ballpark of $62 billion last year. If there were even a 1% adjustment in purchases because of incorrect beliefs, it would represent a swing in spending of $600 million.

It is clear internalities exist, but I’m less convinced they represent solid justifications for tax/subsidy policy. For one, it’s a slippery slope. As I’ve illustrated above, there are likely lots of things we know very little about and where the “experts” would exhibit different preferences and beliefs than the lay person. Thus, the scope for internality-based taxes strikes me as nearly limitless. There’s also the issue of whether we in fact know enough to focus people’s attention on the “right” things.

While taxes are likely have a more direct and immediate effect on consumption than information policies, my sense is that, philosophically, the right approach to a lack of information is information provision, not taxes. Nonetheless, one must acknowledge, even if you give people the objective information, as my paper with Lacey shows, it simply isn’t the case that everyone will suddenly agree on the same level of consumption. This also suggests, however, a potential flaw in the way these internalities are calculated; we can’t just assume people with high vs. low nutrition knowledge or scientific literacy are or will behave the same in every other respect except for their nutrition knowledge or scientific literacy no matter how many controls we add to our analysis.

Thanksgiving Prices 2020

It’s that time of year when folks begin speculating and estimating the cost of the annual thanksgiving meal.  Like so much of life over the past several months, these calculations and even Thanksgiving itself is likely to be “different.”  The most commonly cited and reliable source of publicly available data on food prices comes from the Bureau of Labor Statistics (BLS), which collects prices to compute the Consumer Price Index (CPI).  However, if one travels over to the BLS website, a surprising result emerges: the BLS hasn’t reported retail turkey prices since February before the COVID-19 disruptions began.

What’s going on?  In an August report, the BLS explains. 

To measure price change for food at home, BLS collects data from thousands of grocery stores and other establishments that sell grocery food items. … these prices have traditionally been collected in person by hundreds of trained BLS data collectors in the field. …

In 2019, about 99 percent of food at home prices were collected via personal visit. In June 2020, typical of recent months, about 96 percent of the prices were collected online, with the remaining 4 percent collected via telephone.

While BLS adapted collection procedures for the CPI by shifting to online price collection, some complications were encountered. Some grocery stores had prices available online, others had prices available only through a third party, and some had no online prices available. For some stores, there was even a queue for accessing their website. The availability of many items also decreased as demand surged.

These logistical and market impacts resulted in a decrease in the total amount of prices collected. …

A reduced number of prices collected is not the only issue that complicates price-change measurement for food at home during the pandemic. For some stores in the sample, an item’s online price may be different from, and often higher than, the in-store price for the same day and time. This difference was one of the factors that led to an increase in the food at home index from March to April 2020, because in some cases, online prices were compared with prices previously collected in store.

So, while we’re not exactly comparing apples to oranges, we are now comparing in-store apple prices to online apple prices.  Still, with that caveat aside, here’s what we can gather about the cost of thanksgiving 2020.

Without retail price data, what can we say about the price of the centerpiece of the thanksgiving meal?  Fortunately, the USDA reports movements in wholesale turkey prices, which might give us a clue.  Averaging over frozen and fresh toms and hens, wholesale turkey prices are, at present, about 15% higher now than they were last November and about 30% than they were in November of 2018. 

turkeyprice2020.JPG

It’s not just turkeys, grocery food prices, pretty much across the board, have experienced significant price inflation over the course of the past several months.  According to the BLS, retail grocery prices shot up 2.6% from March to April 2020; this was the largest monthly change in the food at home consumer price index since the 1970s.  Why? COVID-related disruptions led to a run on grocery stores as consumers avoided restaurants and sought to stock up and fill pantries and freezers.  All that extra demand at grocery pulled up prices.  Then, in April and May, shutdowns and slowdowns in beef and pork processing due to worker illnesses reduced the supply of meat products available, leading to a significant price increase for beef and pork. 

While many of the food prices have come back down off the spikes in late spring and early summer, it remains the case that retail food prices are significantly higher now than at the same time last year.  In October (the last data available), the BLS reports prices of food at grocery were 4% higher than the same time last year.  It’s been almost a decade, since 2011, that we observed this rate of annual food price inflation.  Despite the restrictions on eating out, the price of food away from home is also 3.9% higher in October 2020 than in October 2019; this year-over-year change is higher than has been observed in at least a decade. 

cpi_1.JPG

Fluctuations in meat, dairy, and egg prices have been the biggest drivers of the overall food price hike.  In June 2020, prices of these products at grocery were 12.8% higher than the same time in 2019; as of October 2020, prices of these products are still running 6.1% higher than in 2019.  However, the price increases are not just limited to meat and animal products.  Cereal and bakery product prices are 3% higher in October 2020 compared to October 2019; Fruit and vegetable prices are 2.6% higher in October 2020 than in 2019. 

cpi_2.JPG

These year-over-year increases are significantly higher than historical norms.  From 2000 to 2019, the average annual change in retail grocery prices was only about 1.9%.  In fact, throughout much of 2015 and 2016, retail grocery prices actually fell relative to the year prior. 

Back to thanksgiving, there are a variety of new factors affecting the cost of the annual meal.  First, there is likely to be less travel, and thus less eating out. This means one will need more food at home (and thus food purchased at grocery) than is typically the case - factors which might pull up grocery prices.  However, less travel means fewer large gatherings of people at any given meal.  Do you really need a 20lb turkey if all the extra family isn’t coming to visit?  Consumers may choose a smaller-sized young turkey at 10lbs or perhaps even a whole chicken at 5lbs.  While the per-pound prices are typically similar across these different birds, the overall cost is obviously lower if fewer pounds are purchased.  An article last month in the New York Times discussed some of the uncertainty surrounding turkey sizes and turkey demand demand.

There have been increasing numbers of COVID-19 cases in many parts of the country in recent weeks.  Might this lead to food supply chain disruptions like the ones earlier in the year?  I doubt we’ll see the same kind of widespread emptying of grocery shelves we witnessed back in March.  Much of that was caused by the sudden shift in demand away from restaurants and cafeterias toward groceries.  The food system has largely sorted through those demand shocks and has adjusted to the now much larger volume of purchases occurring through the grocery channel.  It is still possible to have some disruptions if a spike of COVID-19 cases affects grocery cashiers or stockers, but these are likely to be localized disruptions.  It is also possible that, as in April and May, workers in food processing or packing plants might experience a rise in cases, leading to shutdowns, which would adversely affect the supply of meat and processed food products.  My sense is that meat packers are much better prepared this time around and have better precautions in place.  While it is certainly possible we may have some meat packing plant shutdowns still in store, I’m optimistic we won’t see the same kind of system-wide disruptions we experienced in April and May. 

Finally, at least in the case of turkeys, the meat industry has probably already produced much of what we’ll eat this thanksgiving.  The turkeys have already been processed and are sitting in cold or frozen storage.  There is a cyclical, annual pattern of turkey (and ham - another holiday favorite) storage; USDA data show that warehouses fill to the brim with hams and turkeys in August and September and then empty out in November and December with the holidays hit. 

turkeycoldstorage.JPG

Overall, we can probably expect a more expensive, more socially distanced holiday. Nonetheless, and in spite of all the craziness in 2020, I suspect we can all still find something for which we can be thankful.

Sustainability Facts Panel

Yesterday, Chipotle announced a new advertising campaign called “Real Foodprint.” As the video below shows, a new app reports on a number of environmental metrics (carbon, water, soil) for different Chipotle meals compared to “conventional” ingredients.

Without knowing much about their measurement approach, I am skeptical of Chipotle’s particular claims (for example, much of the research shows avoiding GMOs, hormones, or going organic increases carbon emissions, water use, etc. per unit of food produced). However, I like the overall idea of try trying to provide more objective/quantitative measures on sustainability.

A problem in our current market environment is that various labels (humane, “all natural” non-GM verified, organic, local) are (often incorrectly) interpreted by consumers to imply products are generally safer, healthier, or better for the environment than much of the research would suggest.

Probably one of my favorite opening lines of an academic paper is by Jonathon Schuldt and Norbert Schwarz entitled “The “organic” path to obesity? Organic claims influence calorie judgments and exercise recommendations”:

organic_bias.JPG

The point isn’t to pick on organic but simply to say that many labels and claims (and, well frankly a lot of marketing) can promote false beliefs (e.g., see this recent paper on redundant labels with Lacey Wilson). One way to try to counteract that is to try to provide more “objective” information. Most food products already carry this sort of information in the form of the Nutrition Facts Panel.

NFP.JPG

What if this approach was broadened to also include sustainability-related outcomes? Either a “sustainability facts panel” or a broadened “food facts panel.”

foodfactspanel.JPG

Such an approach would be more credible if monitored by a third party (rather than one company’s claims) and communicated in a form that was easily comparable across foods and brands. One hypotheses is that such “sustainability facts panels” might lessen the chance for “false beliefs” and “health halos” to emerge with more nondescript labels ; we currently have research planned to address this very question.

Conceptually, I like the idea of outcome-based reporting and labeling. However, there are a number of empirical challenges. I wrote about some of them back in 2015.

In principle, it is possible to imagine something like a nutrition facts panel for environmental issues. However, the two are not as analogous as might first appear. First, scientists have a pretty good idea how to measure the fat, carb, and protein contents of food, whereas measuring C02 or deforestation impacts is tricky business with a lot of uncertainty. Moreover, the nutritional content of a processed food is relatively stable regardless of where the raw ingredients came from, which plant or facility was used to manufacture it, how it got to the store, or how you transported and cooked it. None of this would be true for an environmental label, which would require more more extensive (and more costly) monitoring and tracing, and if it is at all accurate, one could have two Wheaties boxes that are nutritionally equivalent but with very different environmental impacts. That may be all the more reason to inform consumers, but the point I’m trying to emphasize here is the much higher cost and greater uncertainty in informing about nutrition vs the environment.

As the science on these issues progresses, and as more digital information is collected on farms and transmitted up the supply chain, the likelihood of developing more uniform, credible sustainability facts panels increases.