The topic of food price inflation has surfaced again, with a lot of concern being expressed about the issue. Earlier today, I participated in a webinar for the US Chamber of Commerce on the topic. I presented data on the current rate of food price increases and then discussed monetary, demand, and supply-side factors contributing to the phenomena. For those who might be interested, my slides are here. Some of the key graphs are below.
Blog


Most Expensive Thanksgiving Ever?
A couple days ago, I was asked by a reporter whether I thought this year would be the most expensive thanksgiving ever. I sidestepped the question because I didn’t think it was very serious. Today, I see headline after headline after headline is asking the same question or making the claim that 2021 will be the priciest Thanksgiving.
Is it true?
One can certainly look at food prices over time. The figure below shows data from the Bureau of Labor Statistics showing the percent change in prices of food for at home consumption relative to January 1980. In September 2021, the price of food at home is 210% higher than in January 1980. By, this measure we are indeed on pace for the priciest Thanksgiving ever. But, look at the graph. Wouldn’t that statement be true each and every Thanksgiving since 1980? Because of inflation, prices tend to inch upward every year. Thus, looking only at changes in the price of food over a long period time doesn’t really tell us much about whether food is more expensive.

What we want to know is whether food prices are rising at a faster rate than other items that we might care about. One key economic variable many households care a lot about is their income. Income and wages also increase over time because of inflation. But, by comparing prices to income, we can get a sense of whether food items are, in fact, more expensive for a worker.
To explore this issue, I pulled data from the Bureau of Labor Statistics (BLS) on median weekly earnings for people employed full time going back to 1980. I also pulled average price data from the BLS for selected food items that have been reported on a fairly regular basis since 1980. Assuming people work an average of 2,400 minutes a week (40 hours a week * 60 minutes per hour), I calculate the amount of work time it takes to earn enough money to buy selected food items today compared to 1980. To my liking this is a much better measure of whether food is, in fact, more expensive.

Back in 1980, a worker earning the median weekly salary would have to work about 175 minutes (almost 3 hours) to earn enough money to buy a 20 lb turkey. By 2019 (this is the latest data available because the BLS unfortunately stopped reporting retail turkey prices in 2019), shows the median worker only had to work about 80 minutes (1 hour 15 minutes) to buy a 20 lb turkey. Why has the time price of turkey fallen so much? As I described here, there have been incredible efficiency improvements in turkey production over this time.
In 1991, a worker earning the median salary would have to work about 170 minutes to earn enough to buy a 10 lb ham (1991 is the first year BLS reports retail ham prices). Today, the median-salaried worker only has to work 113 minutes to buy a 10 lb ham. The time price of ham is 33% lower today than in 1991. In other words, ham is less expensive today relative to our incomes than it was in 1991.
While the overall trend is less apparent for items like potatoes and bread, it is clear from the figure above that the time-price of these items are not at their peaks. Bread and potatoes were more expensive in the years 2008 to 2012 than they are today.
Steak is indeed expensive today relative to the past. The most recent data suggests a worker making the median wage would have to work about 102 minutes to earn enough to buy 4 lbs of beef sirloin steak at retail. Nonetheless, steak has been more expensive in the recent past. The time price of sirloin steak was higher in 2004 (104 minutes) and 2014 (103 minutes) than it is today in 2021.
The figure above does show that food is more expensive (at least the the way I’ve measured it) in 2021 than was the case before the pandemic began. But, is Thanksgiving 2021 going to be the most expensive ever? No.
Food Processing Dashboards
In my last post, I mentioned the creation of the Center for Food Demand Analysis and Sustainability (CFDAS). As a part of the launch, we are releasing two dashboards to help describe the food processing sector in the United States and to illustrate how the sector has been affected by COVID-19. Thanks to Ahmad Wahdat for his excellent work in creating the dashboards.
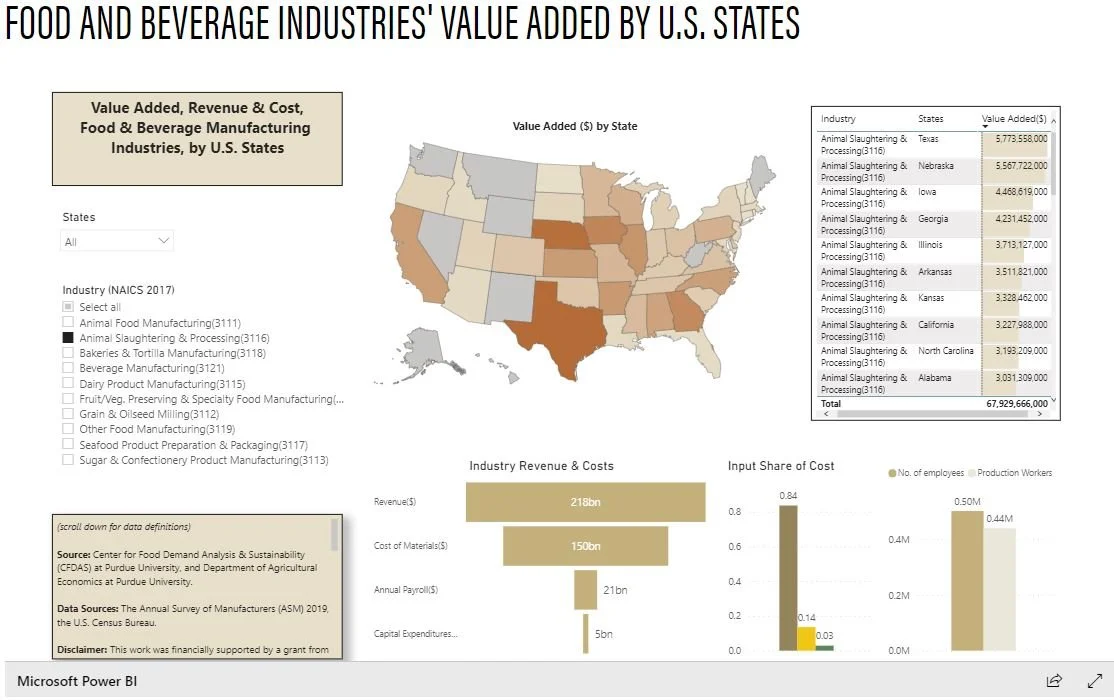
The first dashboard (available here) describes the Food and Beverage Industries’ Value Added by U.S. States.
The U.S. food and beverage industries are the connecting link between the agriculture sector and the grocery retail sector. In a nutshell, the U.S. food and beverage industries buy raw inputs from farmers and sell final or intermediate products to both consumers and producers. This dashboard provides information on each industry’s production value, revenue, costs and employment. All such information is presented at the U.S. state level. Select one (or multiple) states or industries for customized information, and click on a state (within the map) to see geographic variation
The second dashboard is modeled off the Purdue Food and Agricultural Vulnerability Index, which we released over a year ago to provide estimates of farm worker illnesses from COVID19. The new dashboard, we’ve title Food and Beverage Industries’ COVID-19 Vulnerability Index by U.S. States and Counties, extends this analysis to the food processing sector.
This dashboard presents the estimated value of vulnerable production in food and beverage industries due to estimated COVID-19 cases among industry workers. Users can find information on estimated vulnerable production in the past 365 days and past 30 days; COVID-19 industry worker cases in the past 365 days and past 30 days; total industry jobs, and total payrolled industry establishments. This dashboard can display information both at the state and county level.
Users can select one (or multiple) industries for customized information. The U.S. map is presented with state-level view. However, users can click on the double down-arrow button to get a county-level view. We calculate the expected industry workers with COVID19 using real-time information on COVID19 cases.

Center for Food Demand Analysis and Sustainability
I’m happy to announce the formation of a new project I’ll be leading, the Center for Food Demand Analysis and Sustainability (CFDAS). The effort has been underway for a while and is made possible by the Purdue Next Moves initiative, in which the University invested in two initiatives, Plant Science 2.0 and the Digital Innovation in Agri-Food Systems Laboratory (DIAL), both of which house the CFDAS.
The purpose of the CFDAS is to create, interpret, and communicate data about consumer preferences and food markets to help consumers, farmers, agribusinesses, and policy makers improve the food system by making more informed decisions.
The investment in the food and food system space is motivated by several factors:
For every $1 of farm production, consumers spend about $6 food. Thus, there are immense opportunities to add value by better tailoring farm production to consumer demands.
U.S. consumer incomes have risen over time, and today only 8.6% of disposable incomes are spent on food. Thus, U.S. consumers can afford to demand new attributes from the food system.
Digital agriculture, coupled with machine learning, AI, and blockchain, are creating the ability for vast amounts of information to be transmitted across the food supply chain. Thus, changes in consumer demand and pressures to adopt sustainability metrics will more quickly and profoundly impact food processing and farming in the future.
The ability to design, produce, and deliver crops with specific attributes for specific consumer segments is emerging at a fast pace. Thus, understanding which attributes are most important to consumers and how purchase behavior will be influenced by information is critical for success.
Existing sources of data about consumer demand and food markets are often released with significant delays, in arcane formats, and without context for actionable decisions. Thus, there is an opportunity to create a hub for timely, accessible data and insights about consumer demand, food markets, and sustainability.
CFDAS will create and disseminate information in four primary categories:
Food Prices
Food Production and Supply
Consumer Food Spending
Consumer Preferences, Attitudes, Knowledge, and Beliefs.
Data in each category will come from 1) existing public sources that are often in formats that are not easily digestible by the general public or media, 2) data that will be created by CFDAS – most notably by the launch of a new monthly consumer tracking survey, and 3) data that will be acquired through purchase or partnership with outside entities. These data will be used to create dynamic, auto-updating web dashboards which will be hosted on the CFDAS web page. These custom dashboards will be complemented with monthly reports disseminating information from the consumer tracking survey and social-media listening efforts. The CFDAS will serve as a resource for sister initiatives in Purdue Plant Sciences 2.0 and the Digital Innovation in Agri-Food Systems Laboratory (DIAL), as well as for external industry partners, and will provide periodic research reports summarizing data collection and analysis commissioned by these groups.

I’ve staffed up the Center and work is now underway. Have ideas or suggestions for us? I’d love to hear them.
Trade and Resilience
Stories continue to emerge about inflation and supply chain disruptions throughout the economy. When talking to reporters about these issues, I’ve routinely been asked questions premised on the idea that our dependence on imports and exposure to international markets and trade are partially at fault for the volatility. The stories about ships being backed up at ports, the increasing prices of containers, and shortages of truck drivers all contribute to this narrative.
However, my view is that a more localized world, less reliant on trade, is one - at least in the realm of food and agriculture - that would generally be more vulnerable to random supply shocks, not less.
Consider an extreme example. Imagine a small community, Isolationville, exists where the citizens eat only what is grown locally within the community. Now imagine an adverse shock. Perhaps Isolationville experiences a drought in the growing season, or a wildfire, or a flood. Or, a tornado wipes out all the greenhouses or food storage. Isolationville no longer has enough food to feed it’s citizens. Food prices will, as a result, spike in Isolationville. Maybe Isolationville can turn to it’s neighbors in it’s time of need. But if the disaster is climate or weather related, their neighbors’ food supplies are also likely to be adversely affected at precisely the same time Isolationville is in need. Moreover, if their neighbors are like Isolationville - only focused on internal needs - they haven’t planned to plant and grow more in anticipation of their neighbors needing help.
Now, imagine a different community, Cosmopolitanville. Citizens of Cosmopolitanville eat some of their food from local sources but also import food from all around the world. Suppose Cosmopolitanville experiences the same adverse shock as Isolationville - the drought, fire, flood, or tornado. What happens to food prices and food availability in Cosmopolitanville relative to Isolationville? Because Cosmopolitanville’s diet is less reliant on local conditions, it is also less prone to local supply shocks, and Cosmopolitanville will have less food price inflation and less food insecurity than Isolationville despite experiencing the exact same shock.
Seen in this way, trade can act as a form of insurance for food consumers against adverse local shocks. The old saying “don’t put all your eggs in one basket” applies here. Relying only on local production is literally putting all your eggs in one local basket. Of course the same problem would arise if Cosmopolitanville only imported food from a single foreign location. A more resilient strategy would entail trading with a large number of partners unlikely to be affected by the same adverse shocks.
One advantage of the agricultural world in which we live is that we have large globally-linked commodity markets for many products like corn, wheat, and pork. A disaster in any one geographic location may have an impact on the global prices of these products (depending on the locations size and production volume), but it will be muted by production in other regions. Moreover, the rising prices in an adversely affected location serve as the profit signal for firms to incur the costs to shift gears and re-direct food and agricultural products to those areas where it is most needed.
My Purdue colleague, Tom Hertel, serves on the Scientific Group of the UN Food Systems Summit 2021, and as a part of that effort he recently co-authored a paper addressing “Building Resilience to Vulnerabilities, Shocks and Stresses.” Here is what they wrote on the subject of trade as it relates to resilience:
“There are important trade-offs between integration into global supply chains and world markets, on the one hand, and the desire for locally sourced products, with shortened supply chains and greater food self-sufficiency, on the other. Better integration into world markets can ensure food security in the face of local drought, flooding and other natural disasters. In pre-colonial India, weather-induced famines were common, resulting in tens of millions of deaths when flooding or drought destroyed local crops. However, with the introduction of railroads in colonial India, Burgess and Donaldson (2010) find a dramatic reduction in the number of deaths associated with comparable extreme weather events, suggesting that improved market integration greatly enhanced food security by allowing for timely food imports. Recent studies of the role of international trade in mitigating adverse impacts of climate change reinforce the benefits of globalization for resilience to adverse climate impacts (Baldos and Hertel 2015; Gouel and Laborde 2018). However, when the source of adverse shocks is the global market, countries may have an incentive to insulate themselves from these developments. The problem with this strategy is that, the more countries insulate themselves from world markets, the more volatile those markets will become, as was found in the context of the food price crises of 2006-2008 and 2010-2011 (Martin and Anderson 2012). This harms those countries – often the poorest – who rely on these markets for critical food imports.”