Blog

Effects of Prop 12 in California

Back in November 2018, 63% of California poll-goers voted in favor of Proposition 12. The effect of the passage of Prop 12 is to require shell eggs sold in the state to come from cage free production systems. For pork, Prop 12 would impose certain space requirements and effectively ban the use of some housing practices like gestation crates. Prop 12 was slated to take effect on Jan. 1, 2022.

Prior to implementation, many good economic studies were conducted to estimate the potential impacts of Prop 12 on the prices and consumption of eggs and pork in California. For example, this excellent paper by Sohae Eve Oh and Tom Vukina, which was just released by the American Journal of Agricultural Economics, projected that because of Prop 12 in California, “the new marginal costs of what used to be conventional eggs would increase, on average, by 56%. The prices of originally conventional eggs would increase by 65%.” Other studies by Barry Goodwin and by Dan Sumner and Rich Sexton and by Christine McCraken have provide estimates of the cost of Prop 12 on the pork industry.

Now that January 1, 2022 has come and past, what’s actually happening?

For eggs, it appears that the rules around Prop 12 have taken place and are in force. To get a sense of what impact the policy is having, I took a look at the data reported by the USDA in the National Shell Index Price Report. Because the report lists 5-day rolling averages of wholesale prices, I looked at the Friday report of egg prices in California and for the U.S. for the weeks just before and after the first of the year.

Unsurprisingly egg prices in California are higher than in the rest of the U.S. What’s more relevant to the debate around Prop 12 is how that price premium has changed. The average gap between California and U.S. egg prices jumped from 70 cents/dozen prior to Jan 1st to 142 cents/dozen after Jan 1st. As we and others have done in other studies of the effects of prior California egg policies (e.g., see here, here, or here), we can calculate the so-called difference-in-difference, which in this case amounts to 142-70=72 cents/dozen.

That is, California egg prices are 72 cents/dozen more expensive after the 1st of the year than they would have been if the California price-premium had staid at 2021 levels. The California premium jumped 103%. If I apply this changed to premium to the average national egg prices after the 1st of the year, it implies an increase in egg prices in California of about 85%. Why is this observed jump (85%) higher than the projections by Oh and Vukina (65%)? Hard to know, but as Dan Sumner pointed out in a comment on my paper with Conner Mullally on the effects of a prior California animal welfare regulation, legal and regulatory uncertainty can have effects above and beyond the direct effect of the policy itself. Whatever the causes, the evidence here suggests Prop 12 is having significant price impacts on the prices of eggs in California, at least in the initial month following implementation.

Speaking of regulatory uncertainty, let’s turn now to pork. It appears implementation of Prop 12 for pork has been put on hold for at least a few months because the state of California has yet to release final rules, and a state judge pushed off enforcement until final rules are released. So for now, we’ll have to satisfy ourselves with the aforementioned ex ante projections of the potential impacts of the policy on pork prices. For what it’s worth, here’s a slide I prepared for a talk yesterday where I used some of the previous pork demand estimates from an analysis with Glynn Tonsor, coupled with an economic model, to project potential of Prop 12 if it is conceptualized as a tax.

Finally, in case you missed it, my University President, Mitch Daniels, recently weighed in on Prop 12 in an op-ed in the Washington Post.

How people cognitively group different foods

I ran across this interesting ethnographic study of how people conceptualize different foods. It’s a small sample of only 27 people, so one might take the results with a grain of salt, but nonetheless, I found the following figure interesting. The results are from a “pile sorting” exercise where people were asked to group 42 different foods in terms of their similarity to one another in as many groups as they wanted.

Source: Fox, E.L., Davis, C., Downs, S.M., McLaren, R. and Fanzo, J., 2021. A focused ethnographic study on the role of health and sustainability in food choice decisions. Appetite, p.105319.

Source: Fox, E.L., Davis, C., Downs, S.M., McLaren, R. and Fanzo, J., 2021. A focused ethnographic study on the role of health and sustainability in food choice decisions. Appetite, p.105319.

I thought it was interesting that plant-based burgers and milk were neither classified as “meat” or “dairy” or “plant” but in categories of their own; by contrast the in-vitro meat burger was closer to the meat category.

They also found that:

the most salient considerations cited by our participants were price, health, taste, and time.

These findings are consistent with the broad literature on food values; I should note that we have published several papers in the past where we asked larger samples of consumers to rate and rank different foods along multiple dimensions (e.g., here, here, or here)

Understanding Risks and Vulnerabilities via Food Systems Dashboards

That’s the topic of a recent presentation I gave for the College of Agriculture at Purdue just before the Holiday break.

I talked about several new dashboards we’re developing at the Center for Food Demand Analysis and Sustainability. One such dashboard is described here, and it is based on the paper Ahmad Wahdat and I wrote on describing vulnerabilities to different input supplier segments. Ideally, this would be done at a plant-level, but given limited data available, we look at diversity in suppliers to different food processing sectors at the state level. Feel free to play around with the dashboard yourself.

Here’s a video of me walking through the dashboard.

Year in Review - 2021

As the year draws to a close, a recap of activities here on the blog is due. The five most viewed posts of 2021 were:

The “story of the year” had to be rise in retail food prices witnessed in the latter half of 2021. By at least one count, I was cited in 179 media outlets on the topic of food prices this year (see this piece I wrote for EconoFact for a summary of the issues at play).

Overall, there were over 86,000 page views on this site in 2021, and there were 42 new posts. In addition to the new posts mentioned above, there were a number of older posts that continued to attract high attention in 2021, including:

My co-authors and I wrote 12 academic journal articles that have a 2021 publication date. These include:

  • Dennis, E.J., G.T. Tonsor, and J.L. Lusk. “Choosing Quantities Impacts Individuals’ Choice, Rationality, and Willingness to Pay Estimates.” Agricultural Economics. 52(2021):945-962.

  • Malone, T., K.A. Schaefer, and J.L. Lusk. “Unscrambling COVID-19 Food Supply Chains.” Food Policy. 101(2021):102046.

  • Neuhofer, Z. and J.L. Lusk. “Decomposing the Value of Food Labels on Chicken.” Journal of Agricultural and Applied Economics. 53(2021):229-245.

  • Pappalardo, G., M. D’Amico, J.L. Lusk. “Comparing the Views of the Italian General Public and Scientists on GMOs.” International Journal of Food Science and Technology. 56(2021):3641-3650

  • Lusk, J.L. and R. Chandra. “Farmer and Farm Worker Illnesses and Deaths from COVID-19 and Impacts on Agricultural Output.” PLoS ONE. 16(2021): e0250621.

  • Wahdat, A.Z., M.A. Gunderson, and J.L. Lusk. “Farm Producers’ Household Consumption and Individual Risk Behavior after Natural Disasters.” Agricultural and Resource Economics Review. 50(2021):127-149.

  • Chenarides, L., C. Grebitus, J.L. Lusk and I. Printezis. “Food Consumption Behavior During the COVID-19 Pandemic.” Agribusiness: An International Journal. 37(2021):44-81.

  • Chenarides, L., C. Grebitus, J.L. Lusk and I. Printezis. “Who Practices Urban Agriculture? An Empirical Analysis of Participation Before and During the COVID-19 Pandemic.” Agribusiness: An International Journal. 37(2021):142-159.

  • Tonsor, G.T., J.L. Lusk, and S.L. Tonsor. “Meat Demand Monitor during COVID-19.” Animals. 11(2021):1040.

  • Lusk, J.L., G.T. Tonsor, an L.L. Schulz. “Beef and Pork Marketing Margins and Price Spreads during COVID-19.” Applied Economics Perspectives and Policy. 43(2021):4-23.

  • Lusk, J.L. and G.T. Tonsor. “Supply and Demand Indices and Their Welfare Implications.” Q Open. 1(2021):1-22.

  • Ahn, S. and J.L. Lusk. “Pecuniary and Non-Pecuniary Effects of Sugar-Sweetened Beverage (SSB) Taxes.” American Journal of Agricultural Economics. 103(2021):53-69

Next year, I’m looking forward to continuing to build out the data dashboards and products with the Center for Food Demand Analysis and Sustainability.

Hope you have a Happy New Year and a prosperous 2022!

Visualizing Food Price Changes

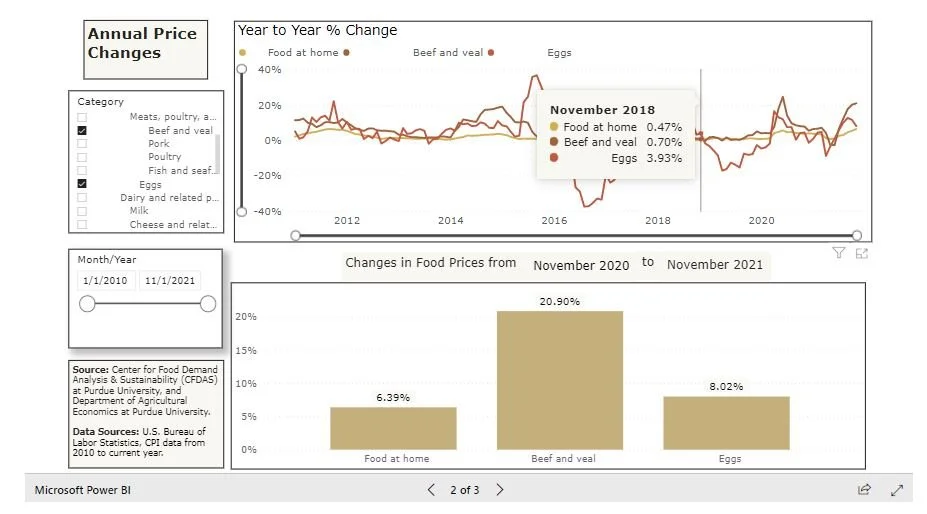
Food prices have been in the news a lot over the past couple years. The Bureau of Labor Statics (BLS) is the “go to” source of public information on food prices, but their website can be a bit challenging to navigate, and the data difficult to use, for the non-specialist.

To make these data “come to life,” my team with the Center for Food Demand Analysis and Sustainability (CFDAS) at Purdue. has created a dashboard that auto-updates each month when the BLS releases new price information. Check out the new dashboard here. Click on the food categories you want to see and hover over the dates to see the calculations at different points in time. Click the small arrows on the bottom (that say “1 of 3”) to switch between comparing changes in monthly, annual, and from-a-chosen-base-date prices.

Check out the live version here.