Blog

Trends in Food Insecurity

In recent months, we’ve experienced some of the highest rates of food price increases since the 1970s. Unless incomes have increased at a comparable rate (which they haven’t), higher food prices imply that consumers’ buying power over food has fallen. That is, consumers cannot afford to buy as much food today as they could in the past. Taken together, all this is reason to keep a close eye on what’s happening to food insecurity.

The official government measure of food insecurity comes out once a year. The most recent release was in October 2022 and corresponded to the year 2021. At that time, the USDA estimated 10.2% of U.S. households were food insecure at some point in 2021. Obviously a lot has happened since then - including a roughly 13% increase in grocery prices.

What is out best current estimate of food insecurity? Is it trending upward?

This is a statistic we’ve been tracking in our monthly Consumer Food Insights Survey we put out in the Center for Food Demand Analysis and Sustainability at Purdue. Despite the arguments above, we haven’t yet detected an uptick in food insecurity rates.

But, maybe something is “off” about out sample, survey, or analysis. Fortunately the Census Bureau started an ongoing “pulse survey” in the wake of the COVID19 disruptions, and they include some questions related to food security (they call their measure “food sufficiency”). Moreover, a few other groups have measured food insecurity rates over the past couple years.

My colleague Sam Polzin has done a masterful job brining together these and a variety of ofther measures of food security from different research groups over the past couple years in the form of a data dashboard that we plan to continue updating.

While there was perhaps an upward trend in food insecurity (or food insufficiency) around the end of last year and the first of this year, food insecurity rates have been fairly flat during most of 2022 (click here if you want to engage with an interactive version of the dashboard).

The result is a bit surprising given the aforementioned increases in food prices and the anecdotal accounts I’ve been hearing from folks working in food banks about being much busier than usual. It is possible that food insecurity hasn’t risen precisely because some of our safety nets have “caught” more vulnerable people and kept them out of food insecurity. For example, SNAP benefits increased in the wake of the pandemic (but are now being scaled back in some states). Still, even in our Consumer Food Insights survey, we are not seeing a trend in the share of people saying they’re getting food from foodbanks.

I’m all ears if someone has a good explanation for the disconnect between the multiple survey-based measures showing stable trends in food insecurity and the reports of longer lines at food banks.

Food and Fuel: Modeling Food System Wide Impacts of Increase in Demand for Soybean Oil

That’s the title of a new research paper I wrote for the United Soybean Board.

The share of soybean oil going toward biofuel production has quadrupled over the past decade. In the most recent marketing year, 43% of all soybean oil used in the United States went toward biofuel production. Beginning in the fall of 2020, crude wholesale soybean oil prices began to rise and have approximately doubled since that time at the same time that retail food prices have been rising.

The dramatic increase in crude soybean oil prices coupled with the increased use of soybean oil in biofuels has raised questions about the extent to which increased use of soybean oil in biofuels has contributed to the rising retail prices of food products for consumers, renewing the old food vs. fuel debates.

To quantify the magnitude effects of rising soybean oil demand on retail food prices, an economic model was constructed linking farm-supply of soybeans to retail-demand for various food items.

What did I find?

An increase in demand for soy-based biofuels does indeed increase retail prices of foods that contain oil, but by a relatively small amount. A 20% increase in quantity of soybean oil demanded for biofuels pushes up retail prices for oil used in frying/baking, margarine, salad/cooking oil, and other oil-containing foods by 0.16%, 0.82%, 4.41%, and 0.16%, respectively. The retail oil price increases are smaller than the wholesale price increases because soybean oil is only a small share of the overall cost involved in producing these retail foods.

Retail prices for animal protein products fall as a result of rising demand for soy-based biofuels. A 20% increase in quantity of soybean oil demanded for biofuels leads to retail dairy, beef, pork, chicken, and egg price declines of -0.02%, -0.01%, -0.06%, -0.13%, and -0.16%, projected respectively. Animal product prices fall because soybean meal, a primary animal feed input, is a co-product of the soybean crush, which also produces oil. Rising soybean oil prices leads to an increased supply of oil, which also leads to an increased supply of meal, thereby bringing down meal prices and the prices of animal products that rely on meal.

Overall impacts of increased demand for soy-based biofuels on the Consumer Price Index are mixed, but the reductions in meat, dairy and egg prices partially offset the increases in oil and bakery prices, leaving the overall food at home portion of the Consumer Price Index essentially unchanged.

Change in Retail Food Prices Resulting from 20% Increase in Demand for Soybean Oil Used in Biofuels

So, it appears that it isn’t food vs. fuel, but rather in this case, food and fuel.

You can read the whole report here.

A Thanksgiving Price Dashboard

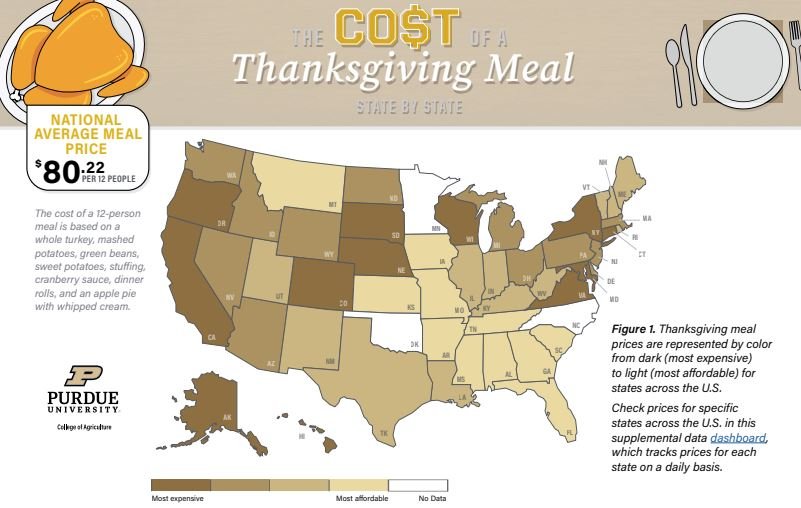
My collaborators and team in the Center for Food Demand Analysis and Sustainability at Purdue have pulled together a couple interesting resources that compare the cost of a Thanksgiving meal across the United States. Check out the infographic here, or the data-dashboard here.

The resources rely on price data we have been scraping from online ordering systems from major grocers across the United States. Our long-term plan is to build out price indices that complement the official Bureau of Labor Statistics food price index; our indices will be timelier and provide information about differences across geography and product characteristics.

For now, I hope you enjoy the Thanksgiving price dashboards. See how prices in your state compare to prices in other states by checking out our data dashboard that will continue to be updated over time. See how conventional turkey prices compare to Organic turkey prices - or even tofu if you prefer a vegetarian option.

Measuring sustainable consumer food purchasing and behavior

That’s the title of a new paper I’ve co-authored with Sam Polzin and Ahmad Wahdat that was just released by the journal Appetite. The paper explores and validates the sustainability-related measures used in our monthly Consumer Food Insights survey. A key result is that although sustainability experts often define the concept using multiple dimensions, consumers’ views are not as nuanced and are captured my a smaller number of indicators.

Here’s the abstract:

Consumer food purchasing and willingness to adopt a sustainable healthy diet (SHD) is a key factor affecting the sustainability of the entire food system. Studies have developed scales to measure consumer preferences for particular consumption patterns, while others have sought to empirically define the multiple dimensions of a sustainable food system (environmental, social, economic, etc.). This paper builds on these literatures by tracking consumers’ SHD behaviors using a large-scale, longitudinal survey of adults in the United States and mapping them onto multiple systems-level indicators. We wanted to know whether consumers interact with the sustainability of their food along the same principles developed by experts. Our study defines 18 food purchasing behaviors that support the sustainability goals of leading scientific institutions, uses factor analysis to identify the unobserved drivers behind these behaviors, and creates SHD scores to investigate their correlations with other consumer characteristics and behaviors. Factor analysis results show consumer food purchasing is motivated by three underlying sustainability dimensions—Economic Security, Socio-Environment, and Nutrition—which are fewer constructs than often defined by academic researchers. SHD scores reveal higher adoption of behaviors that fall under Economic Security relative to the other two dimensions. All three sustainability constructs are impacted by socio-economic and demographic characteristics.

Consumer Food Insights - October 2022

The results of our October 2022 Consumer Food Insights survey are now out.

With Thanksgiving right around the corner, we asked consumers about their plans for the holiday relative to last year. 81% of consumers either somewhat or strongly agreed that the price of turkey would be higher this year compared to last. It appears more people than not are expecting smaller gatherings and less travel this year, which perhaps explains (along with the higher price expectations) the result that fewer people than not are expecting to buy a larger turkey this year.

In terms of our overall tracking statistics, we found that food away from home (FAFH) spending declined for third month in a row. However, food at home (FAH) spending remains high and similar to that observed in the the past five months. Perhaps surprisingly, given the high rates of food price inflation, our measure of national food insecurity is at its lowest point of 2022 so far.

Speaking of inflation, my colleague Sam Polzin who manages the survey and data analysis, noted a remarkable correlation between consumers’ inflation expectations measured in our survey and gas prices, as shown in the figure below.

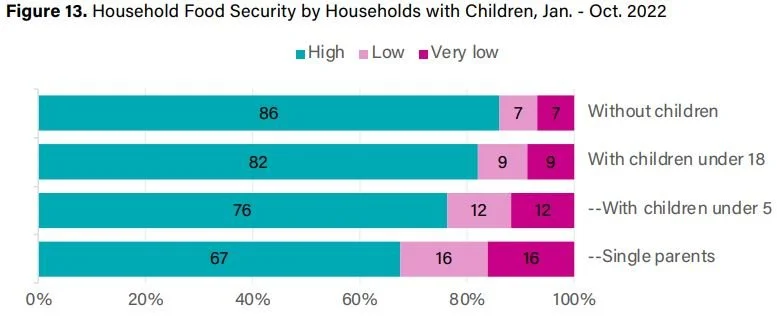
This month, we explored differences in our survey measures between household with and without children. Some of the largest differences were observed for food insecurity. Households with young children and single parents face highest rates of food insecurity.

Finally, we added some questions to compare with a recent Apollo Academic Survey conducted in collaboration with William Masters at Tufts University. That survey asked leaders, fellows, and awardees of the American Society of Nutrition and the Agricultural and Applied Economics Association (i.e., the experts) about their views on nutrition and policy. The survey of experts was motivated, in part, by an article in the Washington Post by Tamar Haspel in which she interviewed Will and me about our views on how to reduce the environmental costs of food production and consumption.

We thought it would be interesting to compare views of experts to those of the general public. The following two figures shows what the general public thinks about several health and nutrition issues. Will, Sam, and I are planning to write a separate piece doing a deep dive into the differences between experts and the public on these matters.

There is a lot more in the full report, which is available here.