Blog

Public Understanding of and Attitudes Toward Bio-Based Labels and Claims

I recently completed a new study for the Plant Based Product Council exploring consumer understanding and attitudes toward bio-based labels and claims.

Given the lack of harmonization and potential public confusion around terms used to describe the bioeconomy, a survey was designed to to determine consumer knowledge, beliefs, and preferences for the following 10 terms: biobased, biodegradable, bioeconomy, bioplastics, biopolymer, circular economy, compostable, organic, plant-based, and recyclable. I conducted a nationwide survey of about 1,500 U.S. residents to explore these issues (note: topline results reporting the share of respondents falling in every response category for every question asked in the survey is provided here).

Here are some of the key findings:

  • Self-assessed, subjective knowledge of bio-based related terms is low. About half the public has never heard the terms biopolymer, circular economy, or bioeconomy; more than half have either not heard or indicate not knowing the meaning of the terms biobased and bioplastics. By contrast, a majority of respondents said they were either somewhat or very knowledgeable of the terms: recyclable, organic, plant-based, biodegradable, and compostable.

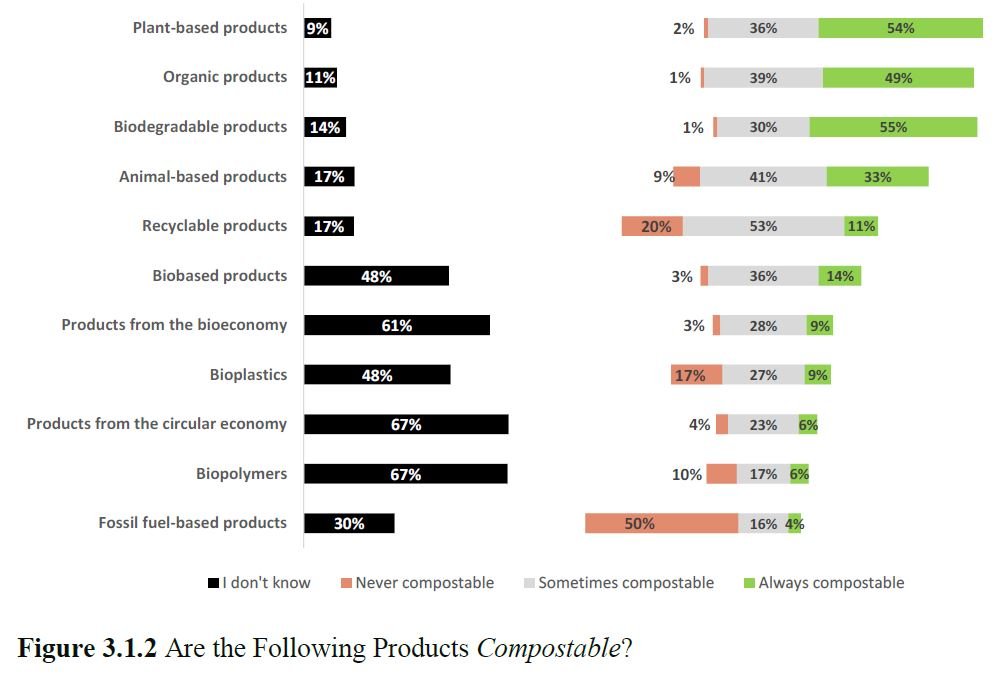
  • Generally, respondents indicated ignorance in knowing whether products that were biopolymers, bioplastic, biobased, or from the circular economy or bioeconomy were or could be recyclable, compostable, or organic.

  • Responses to true/false and definition-matching questions reveal wide dispersion across the public in objective knowledge of bio-based and related terms. Only 0.6% of respondents answered 90% or more of the questions correctly. Forty six percent of respondents answered more questions incorrectly than correctly, and another 11% answered as many questing right as wrong. For example, only 27% of respondents correctly indicated it was false that “All biodegradable products are compostable.”

  • More respondents than not provided incorrect definitions for biodegradable, compostable, organic, and biobased. Respondents were particularly likely to mistake the definition of biodegradable for composable, biobased for organic, and plant-based for biobased. White, non-Hispanics, middle-aged, higher educated individuals, particularly those with graduate degrees, exhibited higher objective knowledge of biobased and related terms, on average, than non-white, young, elderly, or people whose highest education was a high school degree.

  • Compostable, plant-based, organic, biodegradable, and recyclable products were perceived to be high in sustainability and environmental friendliness; the opposite was true of animal-based and especially fossil-fuel based products. Recyclable and compostable products were viewed as relatively affordable whereas organic products were not. Recyclable products were perceived as relatively low in quality whereas organic was perceived as high quality.

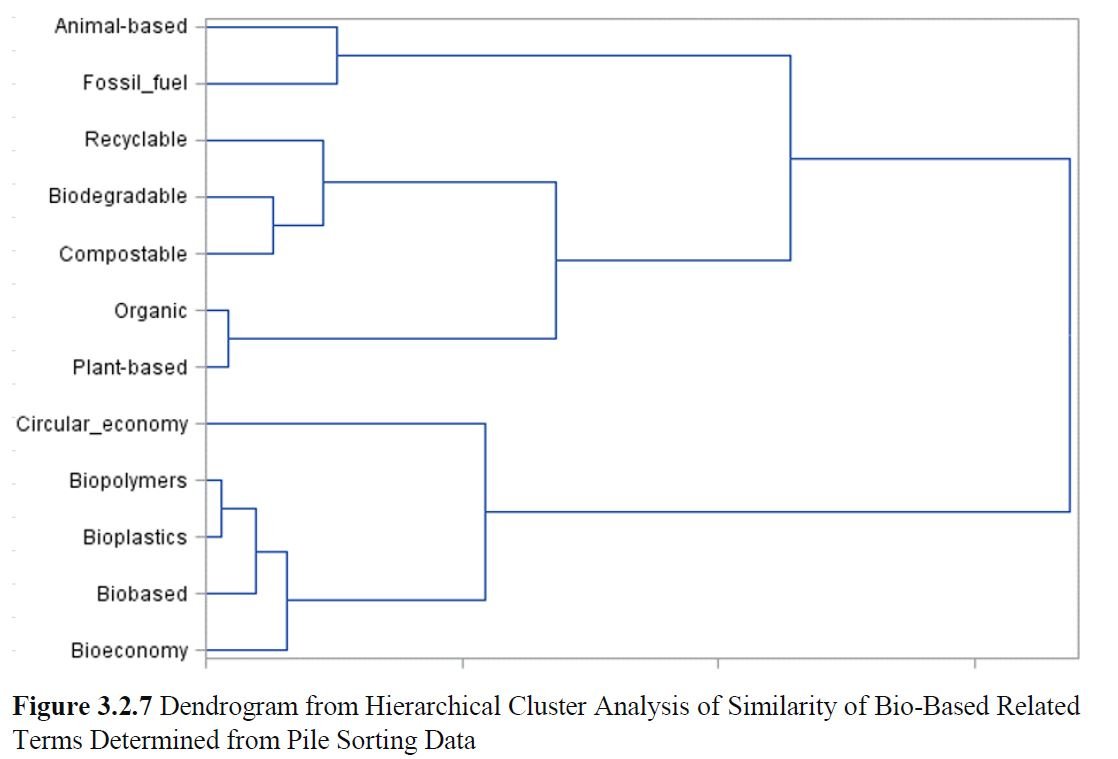
  • Perceptually, respondents tend to view terms like organic and plant-based as being highly similar and related to another grouping of perceptually similar terms: biodegradable, compostable, and recyclable. Perceptually, respondents view all other terms with a “bio” prefix similarly: biobased, biopolymer, bioplastic, bioeconomy. Terms viewed as most dissimilar to the rest include circular economy, fossil-fuel based, and animal-based.

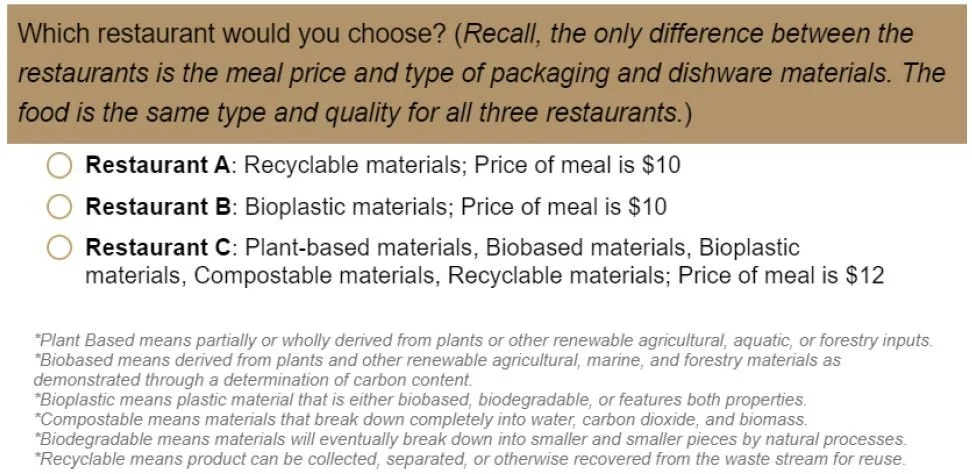
  • Simulated shopping choices indicate respondents are willing to pay significant premiums for take-away food in compostable, plant-based, or recyclable packaging while placing discounts on biobased and bioplastic packaging. Preferences for plant-based, compostable, and bio-based packaging are heavily influenced by the presence/absence of other label/claims, indicating consumers view these terms as having strong complementarity or substitutability relationships with other labels/claims.

  • Choices are significantly impacted by disclosures providing definitions of label terms. Providing definitional disclosures increased willingness-to-pay and choice likelihood for compostable packaging while having the opposite effect for biodegradable packaging, at least when these labels appeared in isolation.

  • Providing definitional information tends to reduce the size of the preference interactions between labels. When packaging already contains many competing claims/labels, provision of information disclosures increases the value of adding a new biobased claim in all instances. However, when adding a single label/claim in the absence of any others, definitional information reduces willingness-to-pay and choice probability for four terms (biodegradable, recyclable, plant-based, and biobased) while increasing it for two terms (bioplastic and compostable). These findings indicate definitional information tends to cause respondents to be more likely to

You can read the whole report here.

Restaurant Spending by Vendor and Location

My team in the Center for Food Demand Analysis and Sustainability (CFDAS) at Purdue University has worked to create two new data dashboards showing consumer spending at restaurants and for food delivery. We partnered with the firm Facteus, which processes debit/credit card transactions, and we use their data to understand trends, geographic differences, and rankings of restaurant in terms of consumer spending.

The first dashboard shows spending at restaurants, including fast food and casual dining (be patient: it might take a few seconds to load; the dataset is HUGE!). The figure below shows the dashboard set to McDonalds (the restaurant with the most sales). Apparently, Kansas is the state with the highest per-capita expenditures at McDonalds, although the highest McDonalds spending occurs in zip codes in Texas and California. The time trend shows McDonalds sales fared pretty well during the pandemic.

By contrast, if we look at a more traditional “sit down” restaurant like Applebee’s, the dip in sales during the pandemic is much more noticeable.

It is fun to look at geographic patterns in per-capita spending. For example, here are several top-selling fast food chains along with a couple regional favorites, including my personal favorite, Whataburger (yes, I am a Texas native).

You can even zoom in to the zip-code level if you want to see spending variation within a state. Have fun playing around with the dashboard yourself.

We have a second dashboard that looks similar except it shows spending patterns on meal delivery apps. Here is a screenshot of spending on Uber Eats, which clearly benefited by the pandemic.

We are looking forward to really digging into these data as we aim to better explore consumers food buying behavior in these food-away-from home markets.

Measuring sustainable consumer food purchasing and behavior

That’s the title of a new paper I’ve co-authored with Sam Polzin and Ahmad Wahdat that was just released by the journal Appetite. The paper explores and validates the sustainability-related measures used in our monthly Consumer Food Insights survey. A key result is that although sustainability experts often define the concept using multiple dimensions, consumers’ views are not as nuanced and are captured my a smaller number of indicators.

Here’s the abstract:

Consumer food purchasing and willingness to adopt a sustainable healthy diet (SHD) is a key factor affecting the sustainability of the entire food system. Studies have developed scales to measure consumer preferences for particular consumption patterns, while others have sought to empirically define the multiple dimensions of a sustainable food system (environmental, social, economic, etc.). This paper builds on these literatures by tracking consumers’ SHD behaviors using a large-scale, longitudinal survey of adults in the United States and mapping them onto multiple systems-level indicators. We wanted to know whether consumers interact with the sustainability of their food along the same principles developed by experts. Our study defines 18 food purchasing behaviors that support the sustainability goals of leading scientific institutions, uses factor analysis to identify the unobserved drivers behind these behaviors, and creates SHD scores to investigate their correlations with other consumer characteristics and behaviors. Factor analysis results show consumer food purchasing is motivated by three underlying sustainability dimensions—Economic Security, Socio-Environment, and Nutrition—which are fewer constructs than often defined by academic researchers. SHD scores reveal higher adoption of behaviors that fall under Economic Security relative to the other two dimensions. All three sustainability constructs are impacted by socio-economic and demographic characteristics.

Consumer Food Spending Over Time by Income

In the past, I’ve showed data on on the relationship between income and food spending. With help from my colleagues in the Purdue Center for Food Demand Analysis and Sustainability (CFDAS), we’ve created a new data dashboard showing how consumer food spending varies over time and by income.

We make use of Bureau of Labor Statistics data on from their annual consumer expenditure survey, and one of their main reports that indicates spending on different categories of food by income quintile.

The dashboard can be used to show inflation-adjusted spending by income over time, and food spending as a share of total income (these are so-called Engel curves). Here’s a screenshot of the dashboard showing spending on food at home in the years 1984, 1990, 2000, 2010, and 2020. At all income levels, one can see that inflation-adjusted spending on food has fallen over time.

It is also possible to see trends for individual food items and different income quintiles. For example, here is spending on fresh fruits and vegetables by the highest income consumers since 1984 both in total and as a share of income.

And, now, the same data but for the lowest income consumers.

Want to see a different food group? Or different income level? Play around with the dashboard yourself.: enjoy!

Some new papers

I’ve been fortunate to have several papers accepted for publication in the past few days - one on meat demand, another on plant-based meat alternatives, and two papers on consumer research methods. Below is a summary of each, starting first with the research methods papers.

1) A Basket-Based Choice Experiment with Vincenzina Caputo in Food Policy. Here’s the abstract:

Although economic research on food consumer demand has exploded in recent years, most survey demand elicitation approaches have substantial limitations for food policy evaluations as they involve consumers choosing only one item out of a bundle. There is a need to design a more flexible approach capturing more realistic consumption patterns. This study introduces such an approach – a basket-based choice experiment – where consumers select their preferred food item or combination thereof. Our basket-based choice experiment includes 21 food items that can be freely combined to construct over 2 million possible baskets. Our results show that when given the opportunity, consumers select multiple items for their basket, most commonly three or four items. A composite conditional likelihood function approach is used to reduce the computational burden associated with modeling the choice of over 2 million possible baskets, and estimates are utilized in a multivariate logit model to calculate the probability of bundle selection and individual food price elasticities. Unlike typical choice experiments utilizing multinomial logit model variants, which forces products to be demand substitutes, our basket-based approach is able to capture a rich set of substitution and complementary patterns, and we find that most of the 21 food items studied are demand complements. The BBCE is used to explore policy questions related to the impacts of changing prices on the healthfulness of consumer dietary choices and the welfare effects of product bans, such as Meatless Monday.

2) A Calibrated Choice Experiment Method with Lauren Chenarides, Carola Grebitus, and Iryna Printezis in the European Review of Agricultural Economics. Here’s the abstract:

Although choice experiments have emerged as the most popular stated preference method in applied economics, the method is not free from biases related to order and presentation effects. This paper introduces a new preference elicitation method referred to as a calibrated choice experiment, and we explore the ability of the new method to alleviate starting point bias. The new approach utilizes the distribution of preferences from a prior choice experiment to provide real-time feedback to respondents about our best guess of their willingness-to-pay for food attributes, and allows respondents to adjust and calibrate their values. The analysis utilizes data collected in 2017 in two U.S. cities, Phoenix and Detroit, on consumer preferences for local and organic tomatoes sold through supermarkets, urban farms, and farmers markets to establish a prior preference distribution. We re-conduct the survey in May 2020 and implement the calibrated choice experiment. Conventional analysis of the 2020 choice experiment data shows willingness-to-pay is strongly influenced by a starting point: the higher the initial price a respondent encountered, the higher the absolute value of their willingness-to-pay. Despite this bias, we show that when respondents have the opportunity to update their willingness-to-pay when presented with the best-guess, the resulting calibrated willingness-to-pay is much less influenced by the random starting point.

3) Benchmarking US Consumption and Perceptions of Beef and Plant-Based Proteins with Hannah Taylor, Glynn Tonsor, and Ted Schroeder in Applied Economic Perspectives and Policy. Here’s the abstract:

This article uses two complementary analyses to document consumption of beef and plant-based proteins along with perceptions held by US consumers. Beef is chosen three times more often than plant-based proteins and consumers hold a positive image of beef overall. Key differences are outlined between regular meat consumers and those declaring alternative diets. Combined these findings extend understanding in the dynamic situation presented by plant-based proteins in the US market.

4) U.S. perspective: Meat Demand Outdoes Meat Avoidance with Glynn Tonsor in Meat Science. Here’s the abstract:

Despite ample discussion of health, environment, and animal welfare effects of meat production and consumption, this article documents past, current, and projected consumption patterns reflecting robust meat demand in the United States. There is some evidence of meat avoidance behavior among a segment of the population, including younger, higher educated, higher income consumers in the Western United States. At the same time, the majority of U.S. residents self-declare as regularly consuming products from animals, and there is evidence of strong demand growth for meat products in recent years. Key factors influencing protein purchasing decisions are presented revealing critical roles of taste, freshness, and safety. Combined this article summarizes both the aggregate and more refined, household-level situation underlying robust meat demand in the U.S.