As I've discussed in the past, I've been measuring consumers "food values" in the monthly Food Demand Survey (FooDS) for the past four years. The way this works is that a list of 12 items is presented to respondents and they are asked which are most and which are least important when buying food. Respondents have to click and drag four of the items into a "most important" box and also put four in a "least important" box, leaving four in neither box (for exact question wording see page 7 of this document).
The advantage of this questioning approach is that it requires a tradeoff - respondents can't say all issues are important and they have to indicate some food values as least important. To create a scale of importance, I simply calculate the percent of times an issue is placed in the most important box and subtract it from the percent of times it is in the least important box, creating a measure that ranges from 100% to -100%.
Month in and month out, we consistently find that taste, safety, nutrition, and price are the four most important food values and environment, origin, fairness, and especially novelty are the least important. Issues like appearance, naturalness, animal welfare, and convenience fall in the middle.
While the above rankings of values are true on average, it is useful to ask: how do food values differ across consumers with different incomes? This question is important because not all consumers have the same preferences, and the people with the ability and connections to affect public policy (and grocery store bottom lines) may give priority to food issues that are less relevant to people in the lower end of the socioeconomic spectrum.
To address this issue, I used some statistical analysis to control for differences in age, gender, education, etc. and then compare how people in different income categories rate each food value. For ease of comparison, I always set the food value of people lowest income category (less than $20,000 in annual household income) at zero and compare how much higher or lower (again on the -100% to +100% scale) people in other income categories are relative to consumers in the lowest category.
Food Values Relatively More Important to the Poor than the Rich
There were three food values for which importance tended to decline with income: price, safety, and taste. The big one is price.

Compared to consumers in the highest income category (more than $160,000/year in household income), consumers in the lowest income category (less than $20,000/year in household income) place 42 percentage points higher level of importance on the price they pay for food. Recall that the scale only spans from +100 to -100, and as such, this is a huge difference in the importance of price. The implication is that policies and actions that adversely affect food prices will matter much more to lower than higher income consumers. This isn't necessarily surprising, but as the above graph shows, the difference in magnitudes is remarkable.
Lower income consumers also place relatively more importance on food safety than higher income consumers as indicated in the graph below, however the differences aren't as pronounced as that for price. Note that this doesn't mean high income consumers don't care about food safety per se, only that safety is less important than other food values to the rich compared to the poor.

Lower income consumers also tend to place a lower relative value on taste than higher income consumers, however, the differences aren't particularly pronounced (at most a 7 percentage point spread between high and low income).
Food Values Relatively More Important to the Rich than the Poor
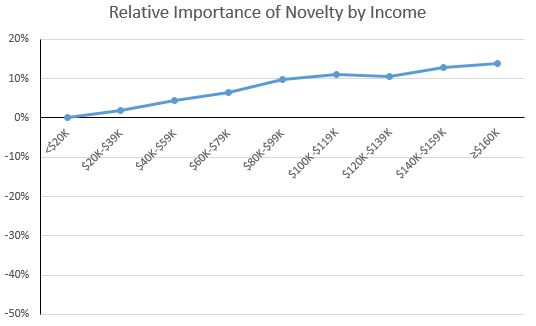
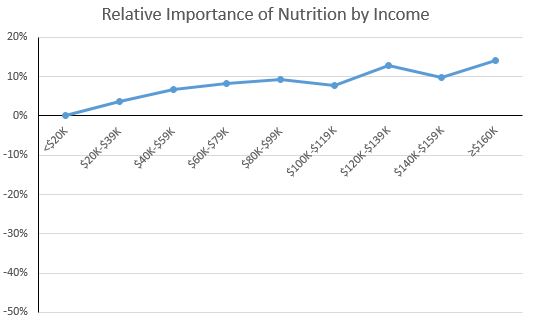
There were five food values for which importance tended to increase with income: naturalness, nutrition, environment, novelty, and origin.
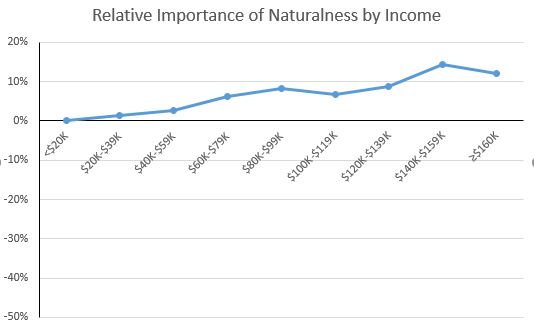
As the figure above shows, the highest income consumers placed about 12-14 percentage points higher importance on naturalness than lower income consumers; for nutrition and environment (see below), the results are similar.

The environment result is somewhat relevant to debates about the environmental Kuznets curve, which posits that as a country's income increases from a low to mid level, the environment degrades, but then as income increases from a mid to higher level, the environment improves. One reason cited for the later results is that as people become wealthier, they care more about environmental amenities. The above graph suggests this is true for the environmental impacts of food production as well.
The figure below also shows that higher income households place a higher relative value on the novelty of food than lower-income consumers. This results is consistent with other research that suggests that lower-income households cannot afford to purchase novel or unfamiliar foods that other household members may not like and that might go uneaten. That is, higher income households can afford the "risk" of trying new foods that may ultimately go to waste.